Figures & data
Figure 1. (A) Rhino® tube set up for the artificial stones above the metal homogenization beads. (B) Laboratory set-up for the treatment of kidney stones placed in tubes and suspended in a water bath to maintain 37 °C.
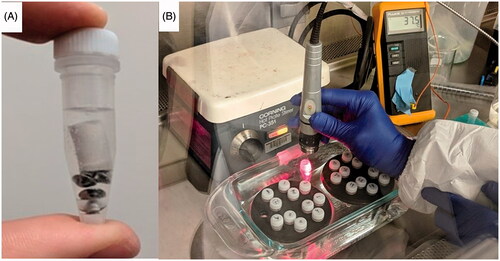
Figure 2. (A) Optical absorption of PCPDTBSe NPs, which shows two main absorption peaks near 420 and 750 nm. The inset shows a TEM image of the NPs. (B) Optical absorption of PCPDTBSe NPs prepared with FITC-PEG. Insets show a schematic of where the FITC-PEG (yellow) is in relation to the green PCPDTBSe polymer and the chemical structure of PCPDTBSe.
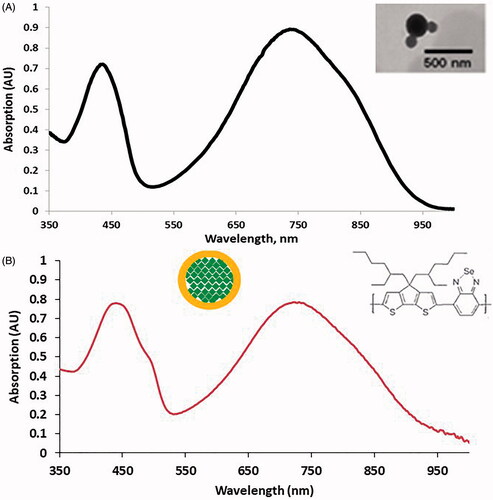
Figure 3. (A) Temperature increases for artifical kidney stones placed on top of homogenization beads and treated with 60 or 300 s of laser light. Temperatures were measured immediately following laser exposure. The box of each group represents the interquartile range, with the middle black line representing the median and the upper and lower lines representing the maxmium and minimum values (*p < 0.001). (B) Temperature increases of a 700 μl volume of water or 100 μg/ml solution of NPs exposed to 5 W of 800 nm light over time.
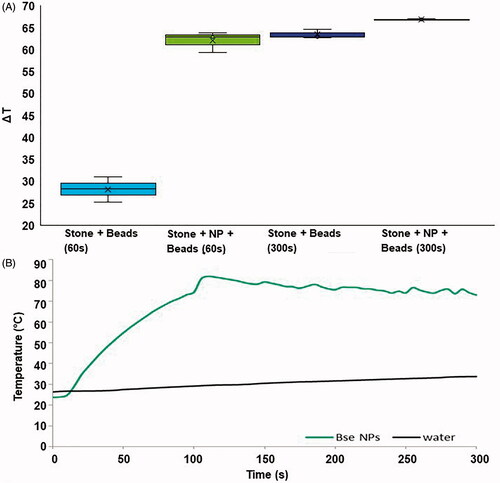
Figure 4. (A) Microscopy image (1×) of artifical kidney stones with E. coli biofilm, without (left) and with (right) 24 h expsoure to PCPDTBSe/FITC-PEG nanoparticles. (B) Brightfield and fluorescence images of the edge of artifical kidney stones with biofilm and with and without PCPDTBSe/FITC-PEG nanoparticles (green). The scale bar is 100 µm.
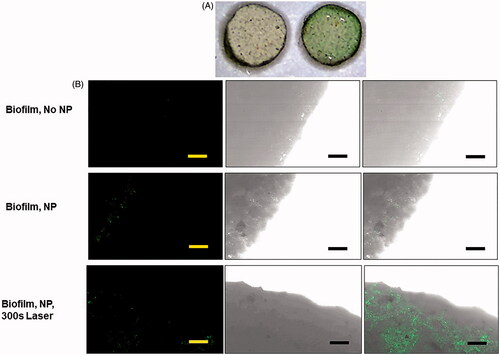
Figure 5. Scanning electron microscopy images of artificial kidney stones without biofilm or with biofilm and various nanoparticle treatments. Also included is a biofilm-coated stone that was autoclaved. All images were taken at 100,000× and the scale bar is 1 µm.
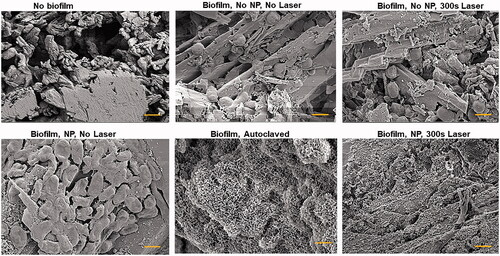
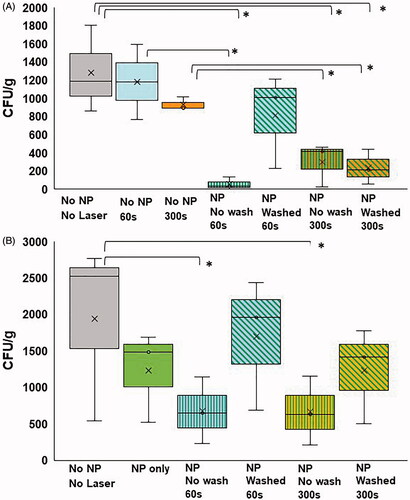
Figure 6. (A) CFU/g of artificial kidney stones treated with no NPs and no NIR (gray); no NPs, 60 s NIR (blue); no NPs, 300 s NIR (orange); NPs, no wash, 60 s NIR (blue with green horizontal lines); NPs, washed, 60 s NIR (blue with diagonal green lines); NPs, no wash, 300 s NIR (orange with green horizontal lines); NPs, washed, 300 s NIR (blue with diagonal green lines) (* indicates statistical significance between groups p < 0.05). (B) CFU/g of patient-derived kidney stones treated with no NPs, no NIR (gray); NPs only, no NIR (green); NPs, no wash, 60 s NIR (blue with green horizontal lines); NPs, washed, 60 s NIR (blue with diagonal green lines); NPs, no wash, 300 s NIR (orange with green horizontal lines); NPs, washed, 300 s NIR (orange with diagonal green lines) (* indicates statistical significance between groups p < 0.05).