Figures & data
Figure 1. Flow chart.
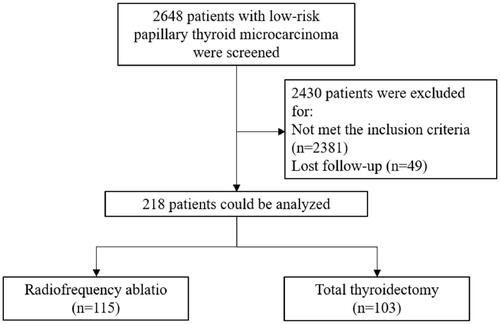
Table 1. Characteristics and clinical features of the patients.
Table 2. Outcomes of the thyroid carcinoma.
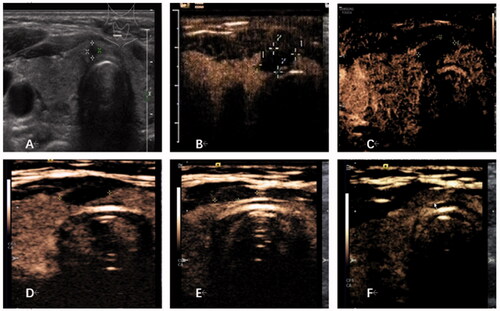
Figure 2. Imaging evaluation of one patient. (A) B-mode ultrasound revealed a hypoechoic nodule on the thyroid isthmus, 3 × 3 × 4 mm in size. (B) Contrast-enhanced ultrasound (CEUS) examination was performed after RFA, and the ablation area was 14 × 6 × 15 mm. (C) One month after ablation, CEUS showed that the ablation area was 10 × 4 × 10 mm, with a volume reduction rate of about 68%. (D) At 3 months after ablation, CEUS showed that the ablation area was 8 × 4 × 7 mm, with a volume reduction rate of about 82%. (E) At 6 months after ablation, CEUS showed that the ablation area was 8 × 3 × 6 mm, with a volume reduction rate of about 89%. (F) At 12 months after ablation, the ablation area was completely absorbed, and the isthmus was uniformly enhanced by contrast-enhanced ultrasound.