
Figures & data
Figure 1. Illustration of the experimental set-up during both HOI-ex conditions.
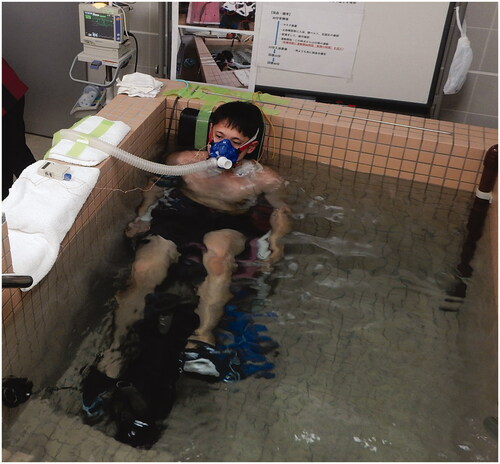
Figure 2. Changes in serum BDNF concentration in response to the three experimental conditions. Data are presented as mean ± SD. *p < 0.01, compared with before immersion (pre). †p < 0.01, compared with 40 °C HOI and 23 °C HOI-ex. BDNF, brain-derived neurotrophic factor; 40 °C HOI, head-out water immersion at 40 °C; 40 °C HOI-ex, cycling ergometer exercise in combination with head-out water immersion at 40 °C; 23 °C HOI-ex, cycling ergometer exercise in combination with head-out water immersion at 23 °C; pre, 30-min rest period prior to immersion; post, immediately after the completion of 15-min immersion protocol; post 15, 15 min after the immersion protocol; post 30, 30 min after the completion of immersion protocol.
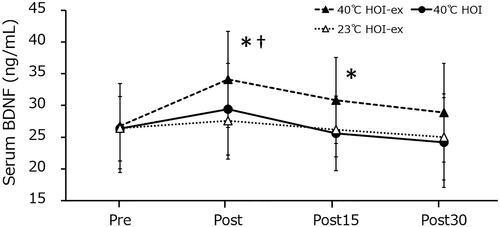
Figure 3. Changes in core temperature during the three experimental conditions. Data are presented as mean ± SD. *p < 0.01, compared with before immersion (pre). †p < 0.01, compared with 40 °C HOI and 23 °C HOI-ex. 40 °C HOI, head-out water immersion at 40 °C; 40 °C HOI-ex, cycling ergometer exercise in combination with head-out water immersion at 40 °C; 23 °C HOI-ex, cycling ergometer exercise in combination with head-out water immersion at 23 °C; pre, 30-min rest period prior to immersion; post, immediately after the completion of 15-min immersion protocol; post 15, 15 min after the immersion protocol; post 30, 30 min after the completion of immersion protocol.
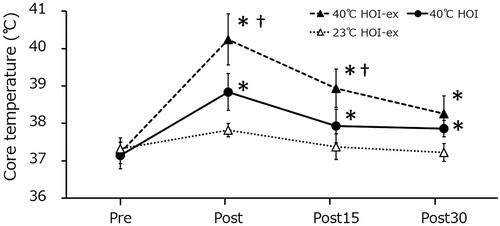
Table 1. The change in physiological parameters in response to the three experimental conditions.
Figure 4. Changes in platelet counts in response to the three experimental conditions. Data are presented as mean ± SD. 40 °C HOI, head-out water immersion at 40 °C; 40 °C HOI-ex, cycling ergometer exercise in combination with head-out water immersion at 40 °C; 23 °C HOI-ex, cycling ergometer exercise in combination with head-out water immersion at 23 °C; pre, 30-min rest period prior to immersion; post, immediately after the completion of 15-min immersion protocol; post 15, 15 min after the immersion protocol; post 30, 30 min after the completion of immersion protocol.
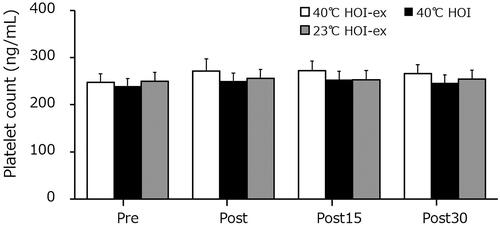
Figure 5. Changes in P-selectin concentration in response to the three experimental conditions. Data are presented as mean ± SD. *p < 0.01, compared with before immersion (pre). †p < 0.01, compared with 40 °C HOI and 23 °C HOI-ex. 40 °C HOI, head-out water immersion at 40 °C; 40 °C HOI-ex, cycling ergometer exercise in combination with head-out water immersion at 40 °C; 23 °C HOI-ex, cycling ergometer exercise in combination with head-out water immersion at 23 °C; pre, 30-min rest period prior to immersion; post, immediately after the completion of 15-min immersion protocol; post 15, 15 min after the immersion protocol; post 30, 30 min after the completion of immersion protocol.
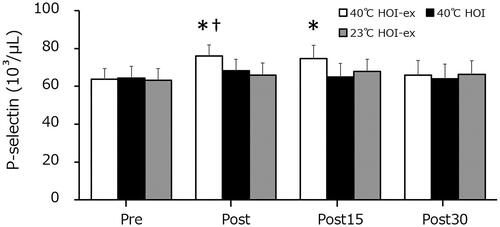
Table 2. Change in plasma cortisol and plasma lactate concentration following the three experimental conditions.