Figures & data
Figure 1. Experimental setup. (A) The animal is positioned on the HIFU table such that the biceps femoris can be sonicated. (B) The rubber tube containing fish oil capsules is visible in MRI and is used to document the target site. (C) MRI with temperature map overlay. Yellow contour: Drift correction ROI with manually excluded areas. Red contour: Target ROI.
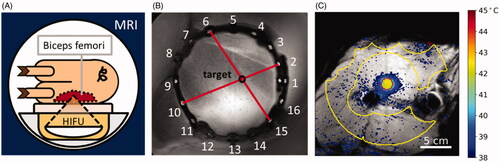
Table 1. Identified model parameters and corresponding physiological quantities.
Figure 2. Example of temperature evolution and temperature/power distribution during different control phases during a sonication, treatment 5/1. The black outline shows target ROI and the points inside the target ROI indicate power allocation. (A) Warmup phase, power is allocated primarily to the ROI’s center. (B) Beginning of steady-state phase; power is allocated primarily to the edges of the target ROI. (C) Late steady-state phase, immediately before the end of the sonication. Power is allocated to the edge and heterogeneously throughout the target ROI.
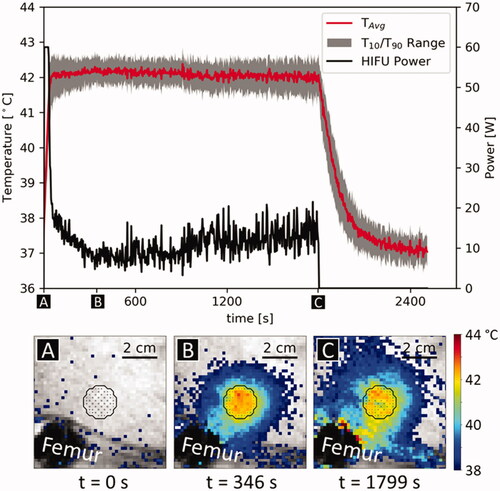
Table 2. Overview of sonication metrics.
Figure 3. Overlay on contrast enhanced MRI images of the respective anatomical region, for animals 1, 2, and 3: Average power application pattern during the first minute after warmup (leftmost column), during the last minute before HIFU shutdown (middle column) and equivalent voxel perfusion during the first minute of cooldown (rightmost column).
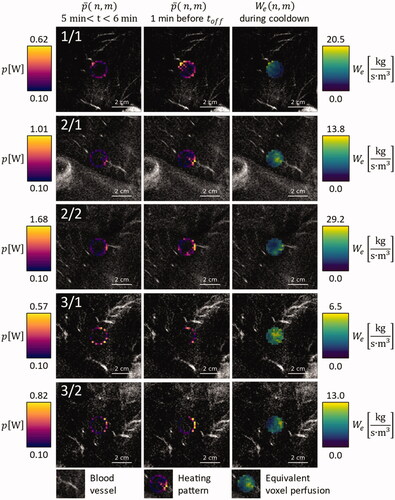
Figure 4. Overlay on contrast enhanced MRI images of the respective anatomical region, for animals 4 and 5: Average power application pattern during the first minute after warmup (leftmost column), during the last minute before HIFU shutdown (middle column) and equivalent voxel perfusion during the first minute of cooldown (rightmost column).
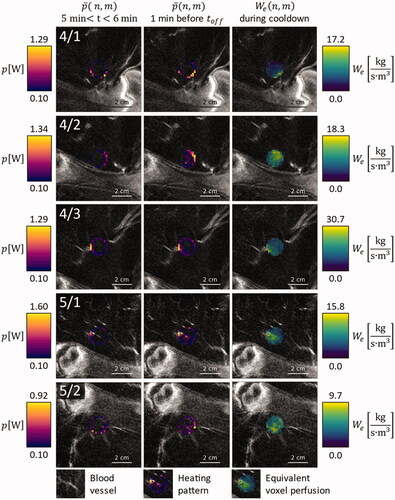
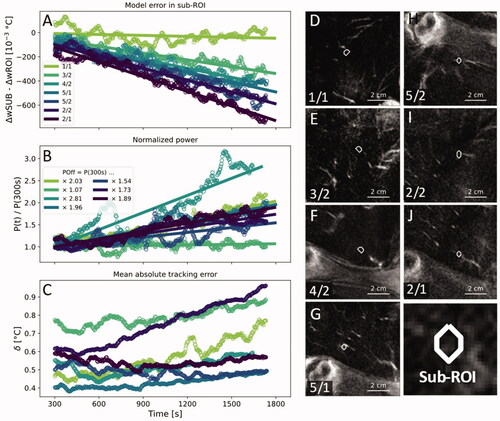
Figure 5. (A) The time-dependent model error in the sub-volumes around the voxel that had received the highest amount of heating energy minus the time-dependent model error in the entire ROI. (B) Total applied HIFU power normalized by the output power at 300 s. (C) Mean absolute tracking error in the target ROI. A one-minute moving average was applied to all data points in (A–C) to enhance clarity. (D–J) Contrast-enhanced MRI with superimposed outlines of the investigated sub-volumes in order from smallest to largest slope in (A). White arrowheads indicate blood vessels that adjoined or penetrated the target ROIs.