
Figures & data
Table 1. Comparison of the general data of the two groups (before propensity score matching).
Table 2. Comparison of general data between the two groups (after propensity score matching).
Figure 1. Axial CT images of the 65-year-old men with lung cancer treated with RFA. Upper left: CT prior to RFA treatment shows peripheral carcinomas in the left lung (arrow); Upper right: CT findings during RFA treatment, the ablation site is covered with ground glass; Lower left: CT image 3 months after RFA treatment shows increased appearance and decreased density of the treated area; Lower right: CT image 6 months after RFA treatment shows ground-glass changes in the treated area, cavitation changes in the primary focus, and surrounding fibrotic scarring with signs of inflammation.
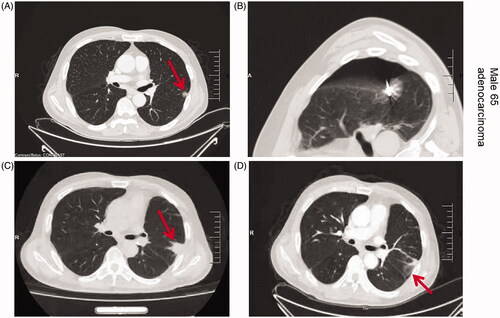
Figure 2. Axial CT images of the 66-year-old women with lung cancer treated with MWA. Upper left: CT prior to MWA treatment shows a single peripheral lesion in the left lung (arrow); Upper right: CT findings during MWA treatment; puncture needle guide electrode reaches the lesion site for MWA; Lower left: CT image 3 months after MWA treatment shows ground-glass changes in the treatment area and decreased density in the central area of the lesion; Lower right: CT image 6 months after MWA treatment shows a reduced ablation area with surrounding signs of inflammation.
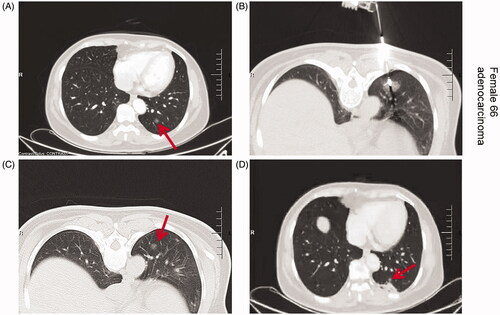
Table 3. Comparison of short-term efficacy between the two groups [n (%)].
Table 4. Comparison of serum tumor markers between the two groups (μg·L−1, X ± s).
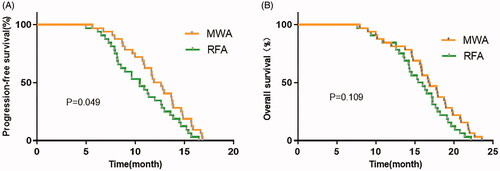
Figure 3. Kaplan–Meier survival curve. (A) PFS; (B) OS.
Data availability statement
The data used to support the findings of this study are included within the article. The data and materials in the current study are available from the corresponding author on reasonable request.