Figures & data
Figure 1. Design schema for the deployable conical ultrasound hyperthermia applicator, consisting of two tubular ultrasound source transducers positioned at the distal end of the catheter, surrounded by a distensible two-compartment balloon, shown in (a) compact profile with the balloon in a collapsed state for device delivery, (b) expanded profile for thermal therapy after positioning at the target site, with the interior compartment filled with water and the outer thin compartment filled with air forming a reflective boundary that directs the ultrasound energy in the forward direction forming an annular beam pattern.
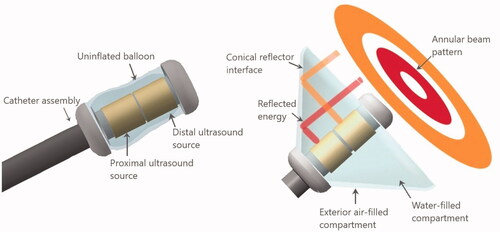
Table 1. Dimensions and configurations of the three applicator geometries modeled in this study.
Figure 2. Cross-sectional slice of the 3D generalized tissue model and conical applicator as applied for parametric acoustic and thermal studies of hyperthermia delivery to pancreatic tumors.
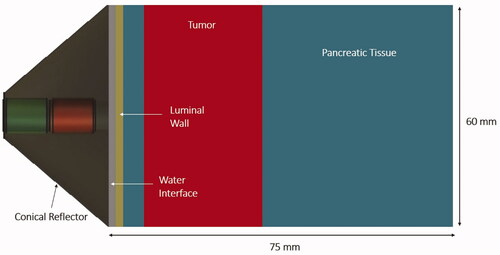
Table 2. Material properties used in acoustic and biothermal modeling [Citation33,Citation34,Citation47].
Table 3. Anatomical characteristics of patient specific models with pancreatic tumors and corresponding deployable ultrasound applicator geometries from .
Figure 3. Intensity distributions (W/cm2) projected from the deployable applicator into the generalized tissue model, (a) with equal input surface intensity (2.44 W/cm2) for both proximal and distal transducers, and (b) power weighting with input power at the distal element four times than the proximal transducer to compensate for the larger geometric intensity decrease inherent to the outer annular distribution. Z-axis represents depth or axial distance from the distal surface of the applicator. Applicator parameters were: 3.4 MHz, 46° conical balloon with 6 cm aperture, and two 10 mm long × 10 mm OD transducers.
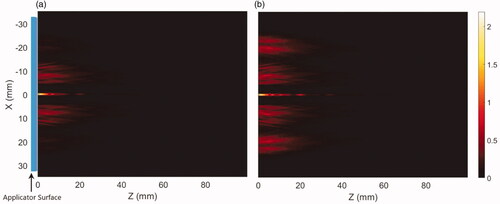
Figure 4. Cross-sectional hyperthermia temperature distributions in the generalized 3D tissue/tumor model for the ultrasound applicator geometry I (6 cm aperture, two 1 cm OD transducers) with (a) equal input powers at both tubular transducers and, (b) modulated input power to broaden the heat distribution (distal element powered 3.4 times higher than proximal), at 3.4 MHz and nominal perfusion and attenuation values. The red, yellow and cyan contours are 43, 41 and 40 °C, respectively. The blue line in the axial and the circle on the transverse planes represent the outer surface projections of the applicator.
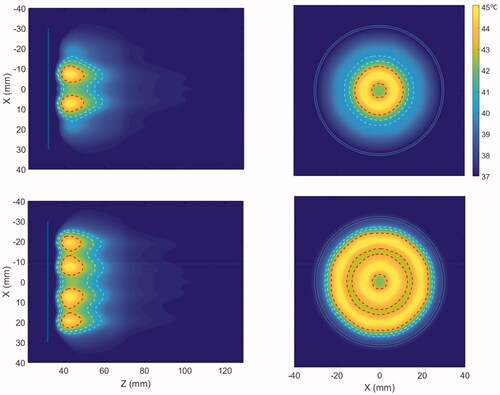
Figure 5. Effect of the operating frequency on hyperthermia temperature distribution in the generalized tissue model for (a) 1 MHz, (b) 1.5 MHz, (c) 2.45 MHz, (d) 3.4 MHz, and (e) 4.7 MHz, with applicator geometry I (6 cm aperture, two 1 cm OD × 1 cm long transducers). The red and cyan contours are 43 and 40 °C, respectively. Nominal values of attenuation and perfusion level were used. The cooling flow water temperature was 20 °C.
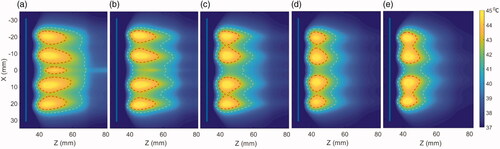
Figure 6. Effect of the operating frequency on iso-thermal heating volumes and the average penetration depth of the heating contours from the luminal wall in the central axial plane. The lines indicate the effect on changing heating volume for 43 °C (red), 41 °C (black), and 40 °C (blue) iso-temperature volumes, whereas the values of the minimum and maximum extent of heating contours for 43 °C (yellow), 41 °C (green), and 40 °C (purple) are overlaid and shown with the right y-axis.
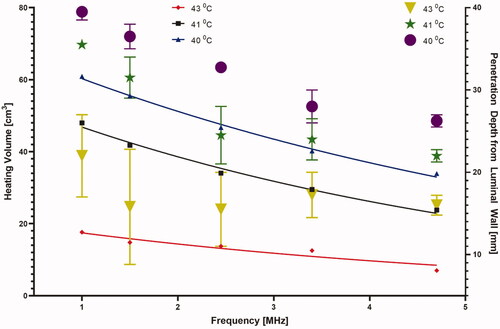
Figure 7. The required input surface intensity at both proximal and distal transducer segments as a function of (a) frequency and (b) attenuation and perfusion, for optimal settings of 45 °C maximum and uniform hyperthermia, p1, p2, and p3 correspond to perfusion values of 0.5, 2.5 and 5 kg/m3/s respectively.
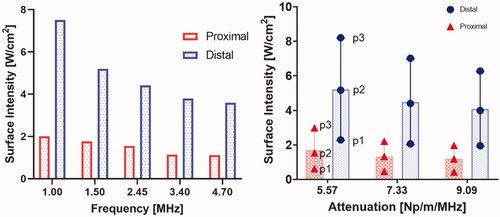
Figure 8. Effect of pancreatic tissue attenuation coefficient and perfusion rate on hyperthermic heating volume as determined by 3D contours > 43 °C (red), > 41 °C (black) and > 40 °C (blue) at 3.4 MHz frequency. Perfusion levels are 0.5, 2.5 and 5 kg/m3/s in the tissue and 50% of these values in the tumor, T1, T2, and T3 corresponds to temperatures at 40 °C, 41 °C, and 43 °C, respectively.
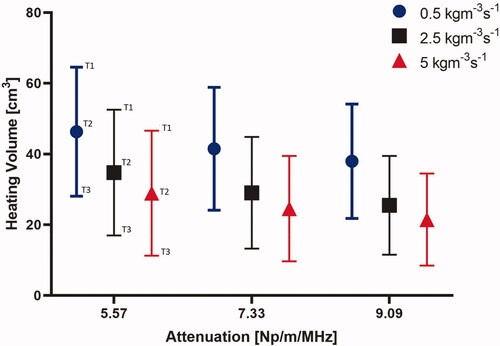
Figure 9. Effect of pancreatic tissue attenuation coefficient and perfusion rate on the maximum penetration depth measured from the outer surface of the luminal wall for geometry I (6 cm aperture, two 1 cm OD × 1 cm long transducers) for: (a) 2D contours in the central plane for T > 43 °C, T > 41 °C, and T > 40 °C and for attenuation values of 9.09 Np/m/MHz (left), 7.33 Np/m/MHz (middle), and 5.58 Np/m/MHz (right), and (b) 2D contours in the central plane > 40 °C (left), > 41 °C (middle), and >43 °C (right). Perfusion levels are 0.5, 2.5 and 5 kg/m3/s in the tissue and 50% of these values in the tumor.
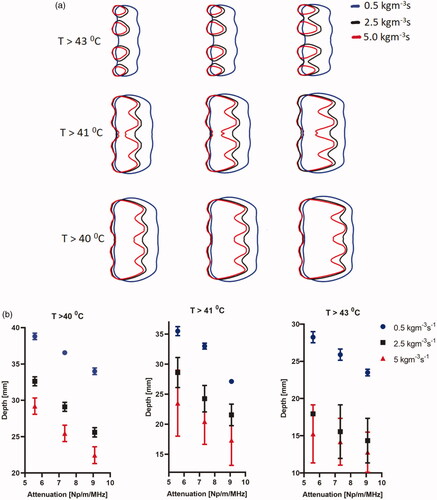
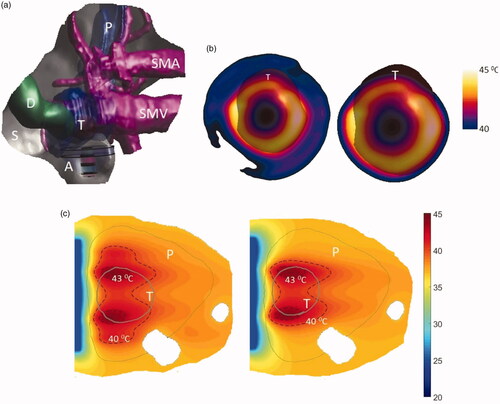
Figure 10. (a) 3D patient specific model and biothermal simulation for endoluminal hyperthermia treatment of a large pancreatic body tumor and surrounding anatomy (model 1): (a) deployed ultrasound applicator (A) (geometry I: two 1 cm OD × 1 cm long transducers, 3.4 MHz, 6 cm balloon aperture) is positioned in the stomach (S) adjacent to lumen wall, and energy directed toward the pancreatic tumor, (b) applicator positioning in the stomach and steady-state temperature distribution overlayed on the planning CT image, (c) detailed temperature distributions with labeled 40 and 43 °C contours across a central axial plane, with both tumor (T) and pancreas (P) delineated; (d) temperature distribution across a transverse plane at 10 mm depth from the applicator surface, with an overlay of the projected tumor boundary; D: duodenum; SMA: superior mesenteric artery; SMV: superior mesenteric vein; SV: splenic vein.
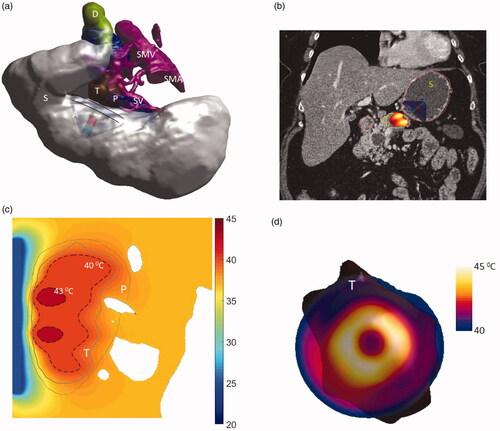
Table 4. Parameters and corresponding thermal dosimetry described for endoluminal ultrasound hyperthermia simulations of four patient-specific patient anatomies and three applicator geometries.
Figure 11. Simulated temperature distributions of endoluminal ultrasound hyperthermia directed at a pancreatic tumor (case II medium body) using applicator geometry II (two 1 cm OD × 0.7 cm long transducers, 3.4 MHz, 4.6 cm balloon aperture): (a) temperature distribution with highlighted 40 and 43 °C contours across a central axial plane, with both tumor (T) and pancreas (P) delineated; (b) Temperature distribution across a central axial plane and a transverse plane at a depth of 11 mm from aperture surface overlaid with model anatomy; (c) 43 °C iso-temperature volume inside the target; and (d) 40 °C iso-temperature volume inside the target. P: pancreas, S: stomach, T: tumor.
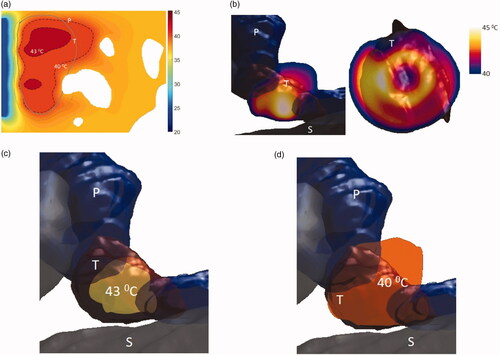
Figure 12. Simulated temperature distributions of endoluminal ultrasound hyperthermia directed at a pancreatic tumor (case III small body) using applicator geometry III (two 1 cm OD × 0.5 cm long transducers, 3.4 MHz, 3.6 cm balloon aperture): (a) temperature distribution with highlighted 40 and 43 °C contours across a central axial plane, with both tumor (T) and pancreas (P) delineated, (b) Temperature distribution across a central axial plane and a transverse plane at a depth of 6 mm from aperture surface overlaid with model anatomy, (c) 43 °C iso-temperature volume inside the target, and (d) 40 °C iso-temperature volume inside the target. P: pancreas, S: stomach, T: tumor.
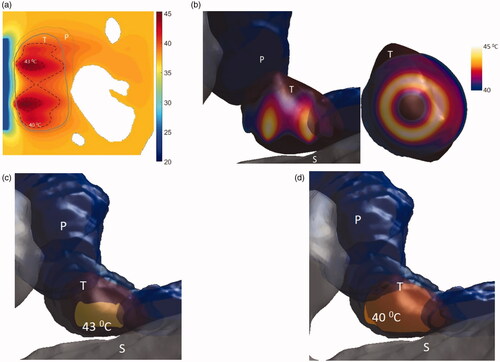
Figure 13. 3D patient-specific model and biothermal simulation for endoluminal hyperthermia treatment of a small pancreatic head tumor and surrounding anatomy (model IV): (a) deployed ultrasound applicator (A) (geometry III: two 1 cm OD × 0.5 cm long transducers, 3.4 MHz, 3.6 cm balloon aperture) is positioned in the pylorus stomach (S) adjacent to lumen wall and close to the pancreas head, and energy directed toward the pancreatic tumor, (b) temperature distribution across a transverse plane at a depth of 6 mm from aperture surface overlaid with model anatomy, when both the transducers are active (left) and when only the proximal transducer is active (right), (c) detailed temperature distributions with labeled 40 °C and 43 °C contours across a central axial plane, with both tumor (T) and pancreas (P) delineated, when both the transducers are active (left) and when only the proximal transducer is active (right). D: duodenum; SMA: superior mesenteric artery; SMV: superior mesenteric vein; SV: splenic vein.