
Figures & data
Figure 1. The flowchart of patient enrollment.
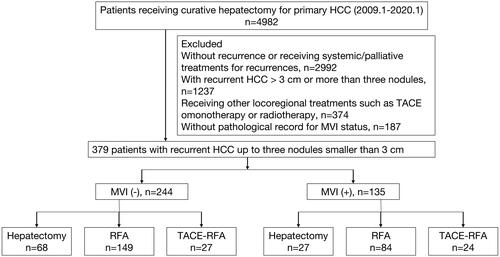
Table 1. Baseline characteristics of recurrent HCC patients receiving different treatments.
Figure 2. The survival curves of recurrent HCC patients receiving hepatectomy, RFA or TACE-RFA. No significant difference was found in sRFS (A) or PRS (B) among the different treatment groups.
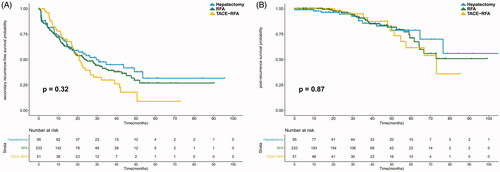
Figure 3. The survival curves of recurrent HCC patients undergoing hepatectomy, RFA or TACE-RFA in groups classified by MVI statuses. (A) sRFS and (B) PRS for the MVI (−) group. (C) sRFS and (D) PRS for the MVI (+) group.
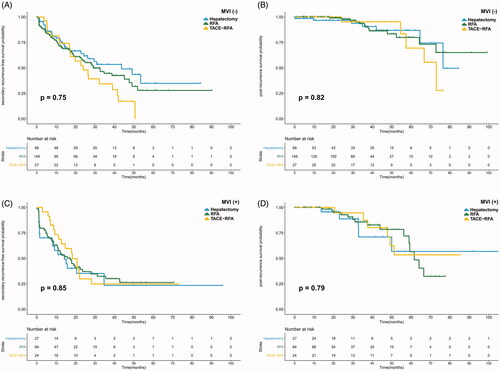
Figure 4. Subgroup analyses of sRFS and PRS for recurrent HCC patients receiving hepatectomy, RFA or TACE-RFA based on MVI status and TTR.
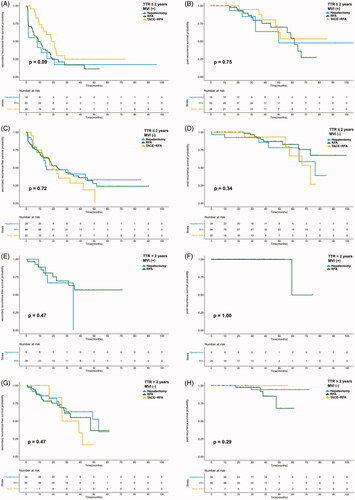
Table 2. Univariate and multivariate analyses of prognostic factors for post-recurrence survival (PRS) and secondary recurrence-free survival (sRFS).