
Figures & data
Figure 1. Images show ablation of pHPT nodule in a 47-year old female. (a) A hypoechoic pHPT nodule with sharp boundary (arrows) was behind superior right lobe of thyroid on US. (b) Uniform hyperenhancement of pHPT nodule (arrows) in arterial phase on CEUS. (c) Establishment of hydrodissection (blue arrow) around pHPT nodule (arrows). (d) Ablation procedure of pHPT nodule (arrows): hyperechoic area emerging inside nodule. (e) After ablation, non-enhancement area covered pHPT nodule (arrows) on CEUS. CEUS: contrast-enhanced US; pHPT: primary hyperparathyroidism; US: ultrasound.
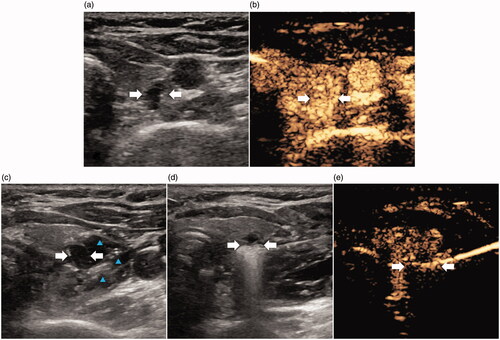
Figure 2. Patient flowchart. MWA: microwave ablation; RFA: radiofrequency ablation; pHPT: primary hyperparathyroidism; PTX: parathyroidectomy.
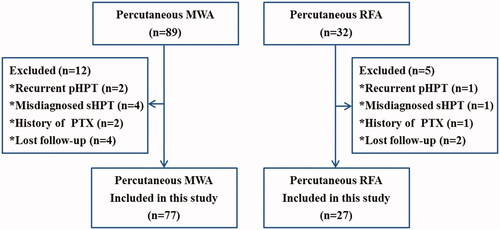
Table 1. Baseline characteristics of patients underwent MWA and RFA.
Table 2. Comparison of treatment parameter and clinical efficacy between MWA and RFA group.
Figure 3. Clinical cure rate curves. MWA: microwave ablation; RFA: radiofrequency ablation; M: month.
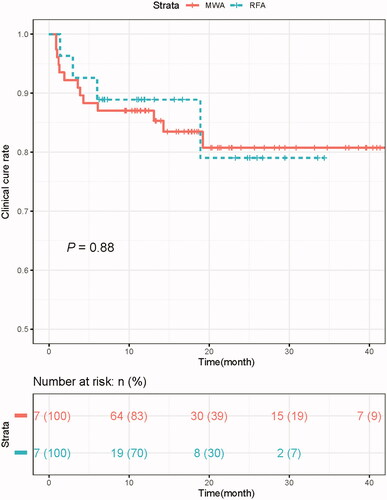
Table 3. The rates of achieving the normal level for iPTH, serum calcium and phosphorus in MWA group and RFA group after treatment.
Figure 4. The comparison of the serum iPTH, calcium, phosphorus, VRR between the RFA and MWA groups at each follow-up period. iPTH: intact parathyroid hormone; MWA: microwave ablation; RFA: radiofrequency ablation; H: hour; D: day; M: month; BA: before ablation; Ca: calcium; P: phosphorus; VRR: volume reduction rate. *p<.001 vs. before ablation.
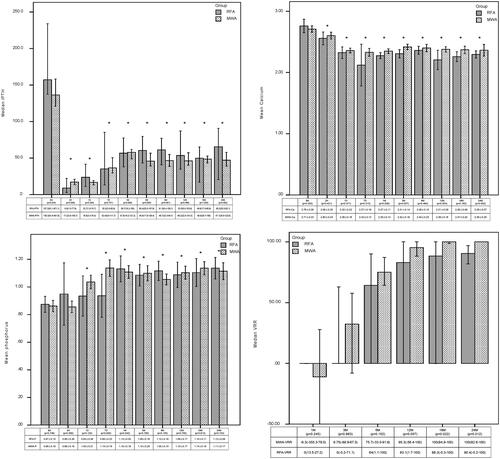
Table 4. Analyses of prognostic factors for patients who did not received ablation cure.