Figures & data
Figure 1. The flowchart of systematic search and screening process.
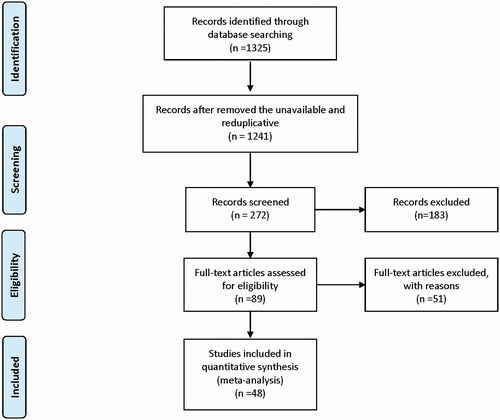
Figure 2. (A) Forest plot of NPVR; (B) Forest plot of treatment time; (C) Forest plot of reduction rate of uterine fibroids volume (month-3); (D) Forest plot of reduction rate of uterine fibroids volume (month-6); (E) Forest plot of reduction rate of uterine fibroids volume (month-12).
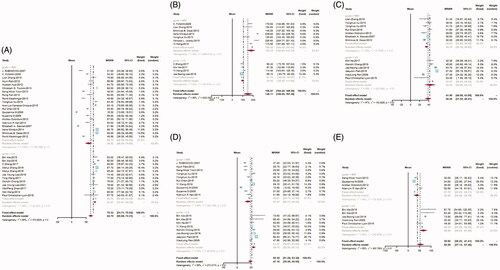
Figure 3. (A) Forest plot of one-year reintervention rate; (B) Forest plot of post-operative skin thermal injury; (C) Forest plot of post-operative sciatic nerve pain; (D) Forest plot of post-operative abdominal pain; (E) Forest plot of post-operative abnormal vaginal discharge.
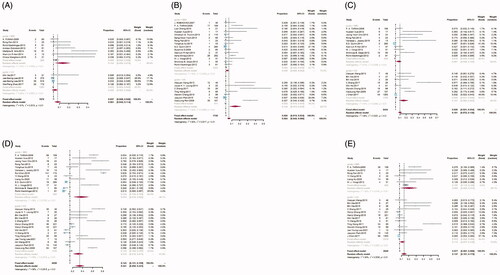
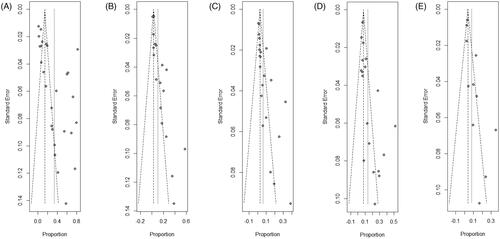
Figure 4. (A) Funnel plot of NPVR; (B) Funnel plot of treatment time; (C) Funnel plot of reduction rate of uterine fibroids volume (month-3); (D) Funnel plot of reduction rate of uterine fibroids volume (month-6); (E) Funnel plot of reduction rate of uterine fibroids volume (month-12).
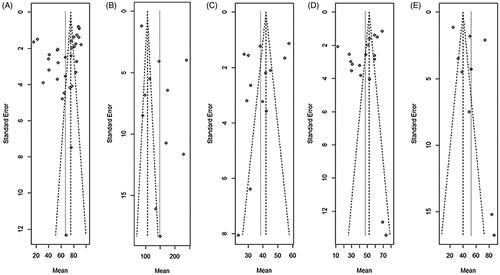
Figure 5. (A) Funnel plot of post-operative abdominal pain; (B) Funnel plot of post-operative sciatic nerve pain; (C) Funnel plot of post-operative abnormal vaginal discharge; (D) Funnel plot of post-operative skin thermal injury; (E) Forest plot of one-year reintervention rate.