Figures & data
Figure 1. (a) Conformal sonication transducer with semipermeable membrane-covered ball. (b) Patient with transducer secured to the medial side of the left knee with a strap.
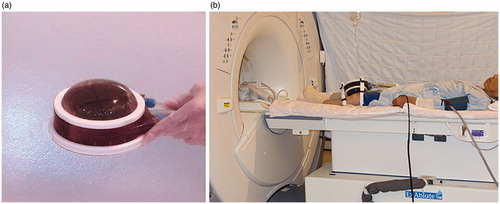
Figure 2. Real-time monitoring on the MRgFUS console display demonstrating sonication of 770 J (27 W, 28 s). Current sonication spot (green circle) and ultrasound beam pathway (light blue area) are shown on the axial-view of MRI.
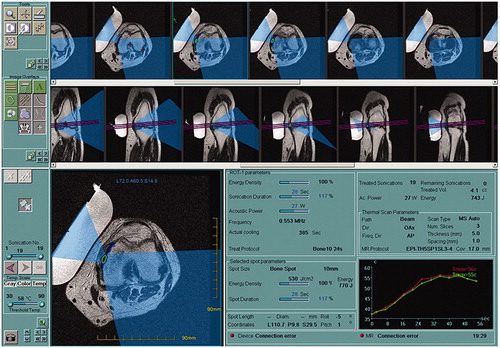
Figure 3. (a) The thermal evaluation screen displaying the results of the last performed sonication. The operator can confirm the results of individual sonication sessions after each sonication or after a series of the treatments. Note the successful previous sonication area is mapped in the dark blue. (b) Temperature elevation is monitored by two curves indicated mean (green) and maximum (red) temperature at the area of the cross cursor in the left screen.
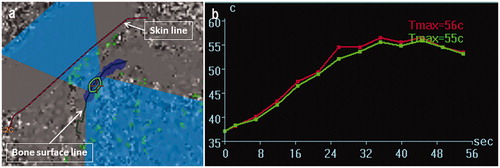
Figure 4. Flowchart of enrollment and analysis.
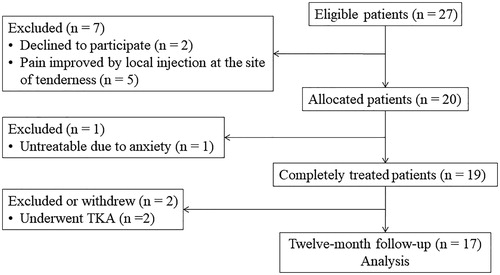
Figure 5. Mean pressure pain thresholds inside the treated knee pre- (baseline) and post-treatment. Error bar represents standard deviation of the mean. *p < 0.005, †p < 0.0005 versus baseline
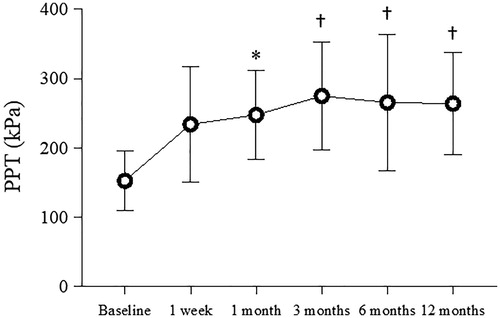
Table 1. Clinical outcomes and analysis.
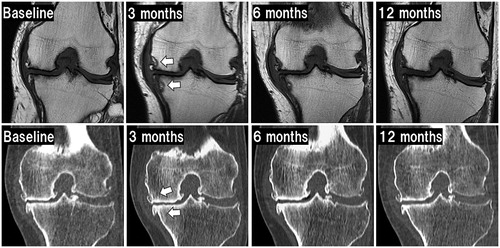
Figure 6. Radiological changes after treatment. Images in the upper row show T1-weighted MRI. Images in the lower row show CT pretreatment (baseline) and post-treatment. Arrows on MRI indicate low intensity changes at the margin of the sonication site. These image findings gradually diminished in this case. Arrows on CT indicate slight osteosclerotic changes at the sonication site at 3 months or later.