Figures & data
Figure 1. Study plan describing the experimental strategy adopted in the present work. Breast cancer tumors were grown on mice flanks and underwent injection of either gold nanorods or saline solution. The aspect ratios of the gold nanorods were selected according to the radiation wavelength of the therapeutic laser beam. Tumor irradiations were performed with four different laser wavelengths, i.e., 808 nm, 940 nm, 975 nm, and 1064 nm, using the same laser settings. Thermographic imaging was utilized for real-time temperature monitoring. Based on the measured temperature values, the quantitative thermal analysis was performed to assess the differences among breast cancer models treated with the diverse laser wavelength-gold nanorod combinations.
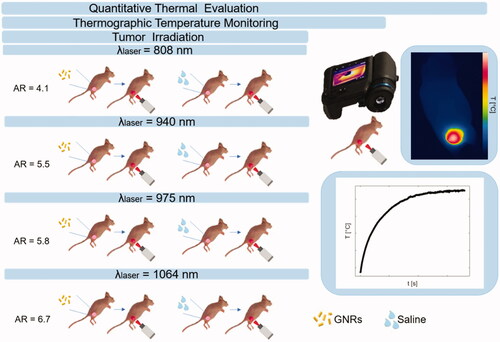
Table 1. Characteristics of the GNRs employed in this study.
Figure 2. Vis-NIR absorbance spectra in a wavelength range of 450–1100 nm for the different GNR types. (a) AR = 4.1, (b) AR = 5.5, (c) AR = 5.8, (d) AR = 6.7.
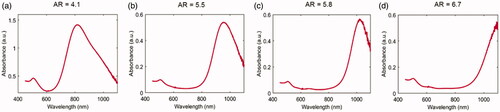
Figure 3. Experimental set-up to perform in vivo photothermal treatments on breast cancer tumors engrafted on mice flanks. It includes: (a) the computer for monitoring the temperature outcome, (b) the laser software for controlling the laser setting parameters, (c) the NIR laser emitter, (d) the collimator placed at applicator tip, (e) the anesthetized mouse bearing the breast cancer tumor, (f) the thermographic camera adopted for the measurement of the superficial temperatures.
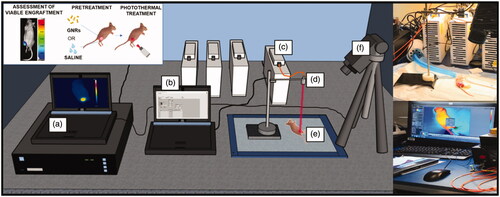
Figure 4. Thermographic images of subcutaneous 4T1 tumors at different exposure times of NIR laser irradiation, i.e., pretreatment (t = 0 s), 30 s, 60 s, and 90 s. Thermographs show the temperature values attained for GNR-treated tumors (a–d) and saline-injected tumors (e–h), irradiated at the different radiation wavelengths: 808 nm (a,e), 940 nm (b,f), 975 nm (c,g), and 1064 nm (d,h). An exemplificative image of the region of interest (ROI) defined in each thermograph is also reported.
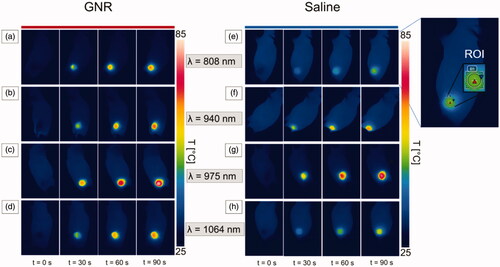
Figure 5. Temperature vs. time, and thermographs after a NIR-light exposure time of 90 s for GNR-injected tumors (red lines) and saline solution-loaded tumors (blue lines), undergoing laser irradiations at different wavelengths: (a) 808 nm, (b) 940 nm, (c) 975 nm and (d) 1064 nm.
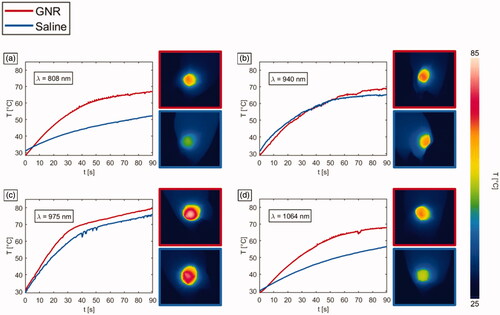
Figure 6. Mean values of the maximum temperatures () reached in tumors undergoing photothermal treatments. (a) Temperatures displayed according to the employed laser wavelengths. The significance is reported on the barplots: **** for p < 0.0001, ** for p < 0.01, non-significant (n.s.) difference otherwise. (b) Temperatures shown according to the injection groups, i.e., either GNRs with different ARs or saline solution. (c) Effective temperature enhancement (
) expressed in percentage, for the different GNR-laser wavelength combinations.
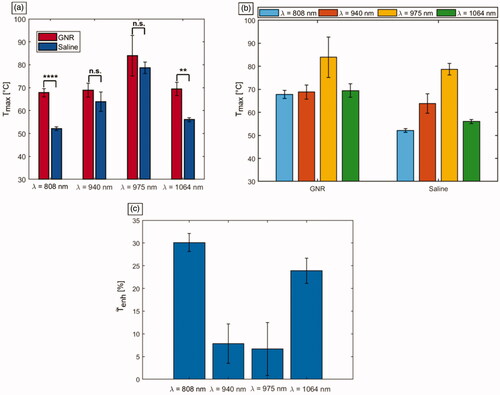
Table 2. Mean temperature change (ΔT [°C]) exhibited for GNR-injected tumors (GNR) and saline controls (Saline), undergoing laser irradiation at different laser wavelengths, and attained values of the heating efficiency (HE) associated to photothermal procedures.
Figure 7. Analysis of the time constants associated with the temperature trends of laser irradiated tumors. (a) Representative graph depicting the experimental tumor temperature values measured during the photothermal treatment and the associated exponential fitting curve. The equation of the fitting curve, the R-square, and the RMSE are also reported. (b) Time constants (τ) associated with the temperature evolution of GNR-loaded and saline-injected tumors, undergoing laser exposure at the different selected wavelengths.
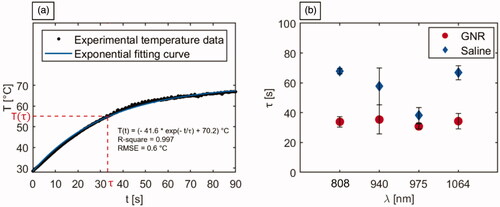
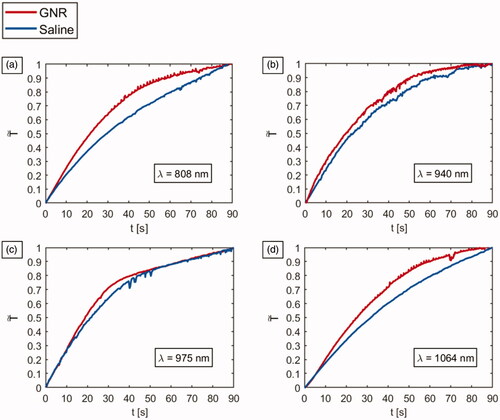
Figure 8. Trends of vs. time for tumor injected either with GNRs (red line) or saline (blue line) subject to NIR-laser irradiation at the different radiation wavelength: (a) 808 nm, (b) 940 nm, (c) 975 nm, and (d) 1064 nm.