
Figures & data
Figure 1. (A) Measurement of distance between PTC tumor to thyroid capsule 348 (double headed arrow); (B) PTC tumor abutted to thyroid capsule without CI.
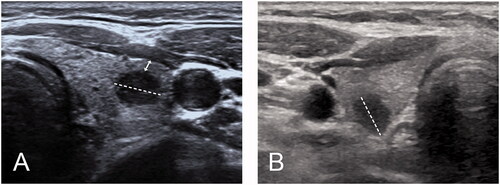
Table 1. Inclusion and exclusion criteria for study designs.
Figure 2. Flow chart of patient selection.
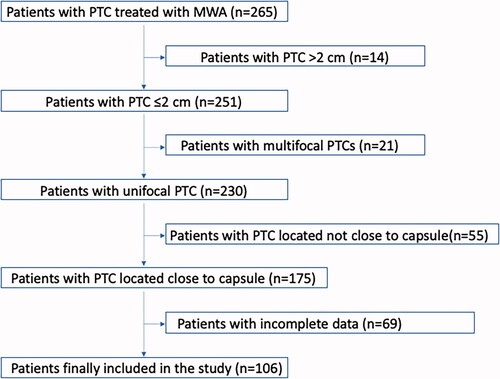
Table 2. Demographic characteristics of enrolled and excluded cases in this study.
Table 3. Demographic characteristics of patients with PTC close to capsule included in this study (n = 106).
Figure 3. A 33-year-old woman with papillary thyroid cancer close to the capsule was treated with microwave ablation (MWA). (A) pre-MWA, ultrasound (US) showed a hypoechoic target tumor (arrows); (B) before MWA, contrast-enhanced US (CEUS) showed a hypo-enhancement pattern in the artery phase (arrows); (C) the hydrodissection technique (triangles) was used to protect the trachea surrounding the tumor (arrows); (D) US showed a hyperechoic pattern in the tumor (arrows) during ablation; (E) post-MWA, CEUS showed no enhancement (arrows) in the tumor area; and (F) on 1 month post-MWA, US showed a hypoechoic ablation zone (arrows).
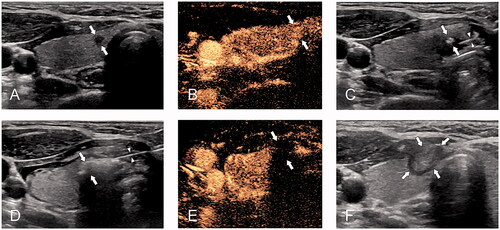
Figure 4. Changes in mean volume at each follow-up time point.
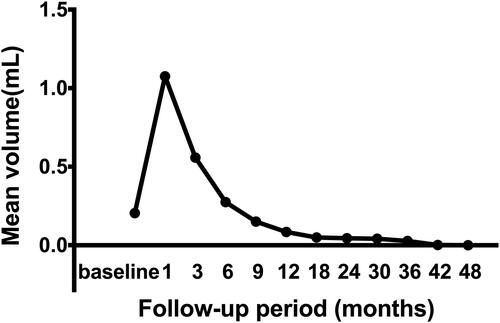
Figure 5. Changes in VRR at each follow-up time point.
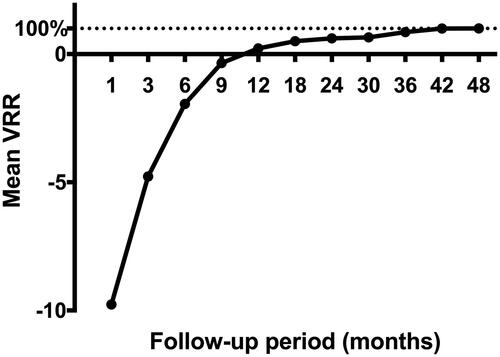
Table 4. Indicators of thyroid function before MWA and after MWA.
Table 5. Tumor size (maximum diameter and volume) before MWA and at each follow-up time-point after MWA.
Data availability statement
The datasets used and/or analyzed during the current study are available from the corresponding author on reasonable request.