Figures & data
Figure 1. A 3 D renal artery and surrounding tissue model.
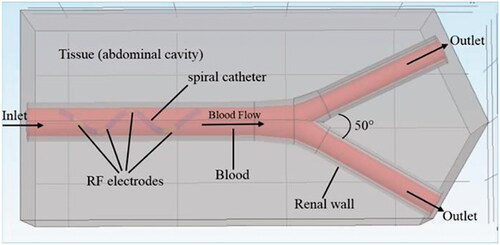
Figure 2. Electrode structure diagrams of three different RF applicators.
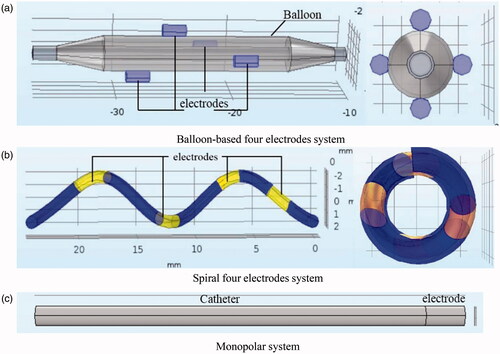
Table 1. The electrode sizes with three-electrode configurations [Citation7,Citation24,Citation25].
Table 2. The thermo-electric and fluid properties [Citation17,Citation26,Citation27].
Figure 3. Thermal and fluid Boundary conditions.
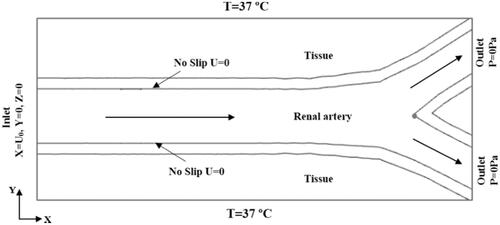
Figure 4. Temperature-dependent thermal and electrical conductivity.
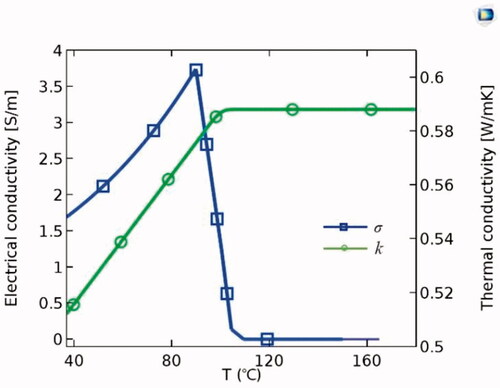
Figure 5. The tissue-electrode interface temperature curves with a number of mesh cells.
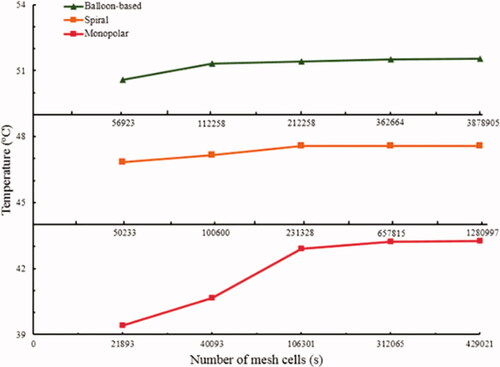
Figure 6. Illustration of lesion size using the different applicators. (a) Balloon-based RDN, (b) spiral RDN, (c) Monopolar-RDN, and (d) Lesion angle.
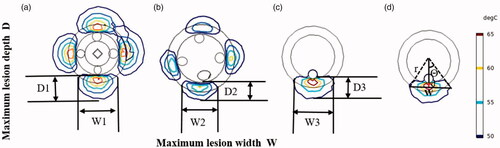
Figure 7. Schematic diagram in a renal artery phantom ablation.
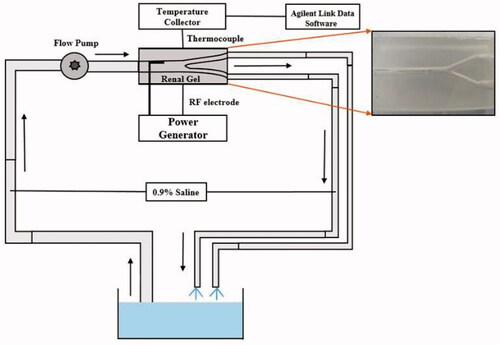
Figure 8. Schematic diagram of thermocouples arrangement.
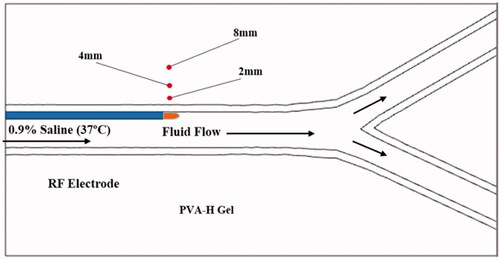
Figure 9. Temperature distribution in tissue using different RF applicators. (a) The balloon-based system, (b) spiral system, (c) monopolar system.
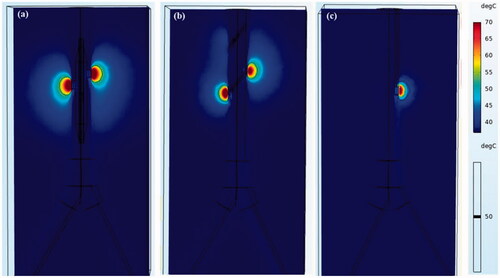
Figure 10. Maximum lesion depth and width curves of three applicators with heating time. D: Maximum lesion depth; W: Maximum lesion width. (D1, W1: for balloon-based RDN. D2, W2: for spiral RDN. D3, W3: for monopolar RDN).
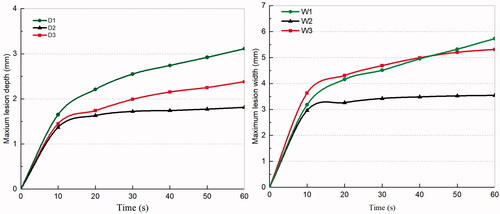
Figure 11. Temperature field in the short-cross section after RDN for three applicators (P = 8W) (a) balloon-based system, (b) spiral system, (c) monopolar system.
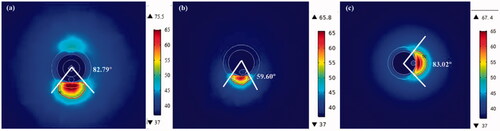
Table 3. Lesion size after RDN for three different applicators (P = 8W).
Figure 12. Temperature curves of the tissue-electrode interface.
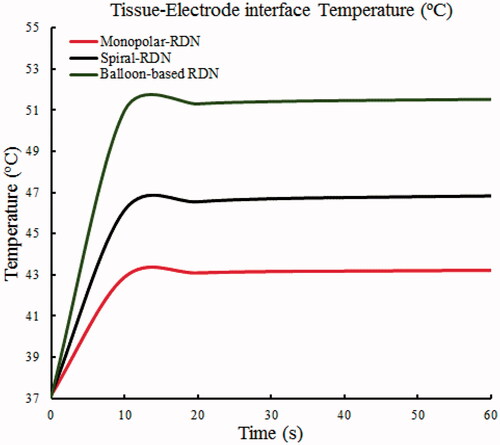
Figure 13. The velocity and lesion zone distribution of renal artery before and after RDN. (a) Before RDN, (b) Balloon-based RDN, (c) Spiral-RDN, (d) Monopolar-RDN.
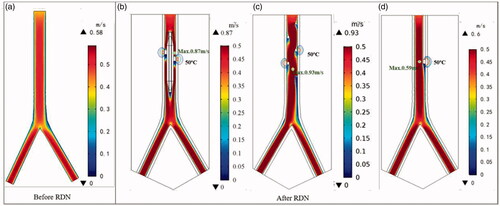
Figure 14. The blood velocity change after RDN with different electrodes. (a) Peak velocity (b) average velocity.
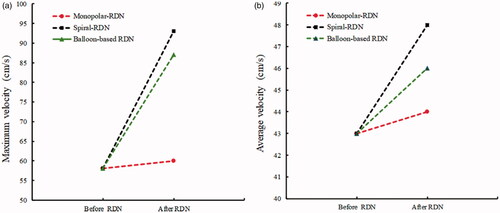
Table 4. Coagulation zone information for each applicator design.
Figure 15. Comparison of experimental and simulated temperature curves.
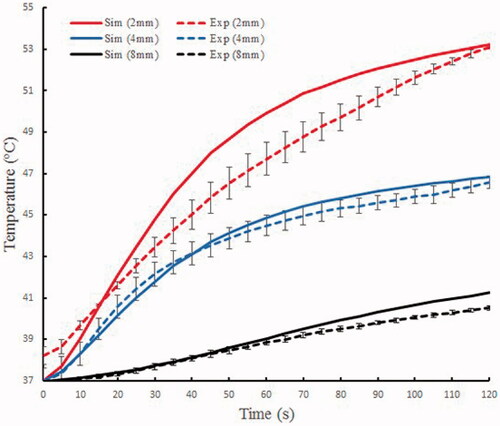
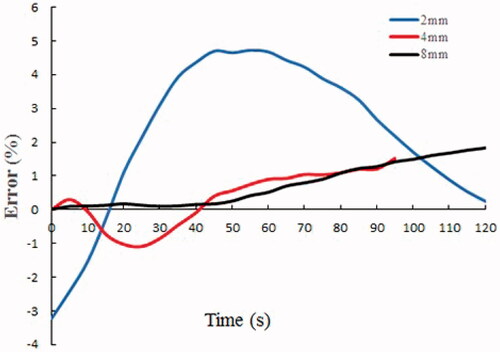
Figure 16. The error curves of the experiment and simulation.