
Figures & data
Figure 1. Evaluation of the distance between the radiofrequency ablation (RFA) electrode tip and large vessel, ablation time and specimens/images of different groups. Tissue specimens obtained after euthanizing beagles at 24 h after RFA (first column), conventional ultrasound before RFA (second column), color Doppler ultrasound before RFA (third column) and post-RFA ultrasound (fourth column) are shown. The first row represents a distance of 0.5 cm from the tip of the RFA electrode to a large vessel with the ablation time set at 3 min (3 min 0.5 cm). The second row shows the electrode tip near the large vessel with the ablation time set at 3 min (3 min 0 cm). The third row represents a distance of 0.5 cm from the tip of the RFA electrode to a large vessel with the ablation time set at 5 min (5 min 0.5 cm). The fourth row represents that the electrode tip was near the large vessel with the ablation time set at 5 min (5 min 0 cm).
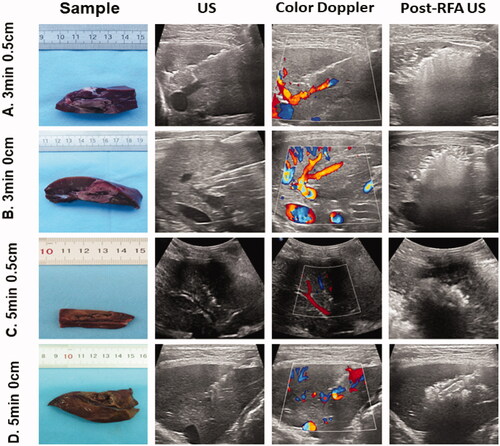
Table 1. Comparison of the ablation zones among different groups.
Figure 2. Comparison of protocols with a fixed time. The graph depicts the mean (± standard deviation) distance and area of the two groups. (A) With the time fixed at 3 min, the ablation length, width, depth and area created using a distance of 0.5 cm were significantly larger than those created using a distance of 0 cm (length: p = .001; width: p < .001; depth: p = .019; area: p < .001). (B) With the time fixed at 5 min, there was no significant difference when the distances were 0 cm and 0.5 cm (length: p = .140; depth: p = .611). The ablation width and area when the distance was 0 cm were significantly smaller than when the distance was 0.5 cm (width: p = .007; area: p = .001). ***p < .001. **p < .01. *p < .05.
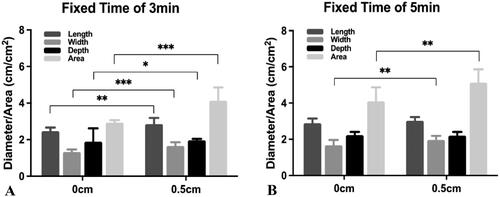
Figure 3. Comparison of protocols with a fixed distance. The graph depicts the mean (± standard deviation) distance and area of the two groups. (A) At a fixed distance of 0 cm, the statistically significant differences were observed when the ablation times were 3 min and 5 min (length: p < .001; width: p < .001; depth: p < .001; area: p < .001). (B) At a fixed distance of 0.5 cm, the ablation length created with an ablation time of 3 min was not statistically different from that created with an ablation time of 5 min (length: p = .112). The ablation width and ablation zone created with an ablation time of 5 min were significantly larger than those created with an ablation time of 3 min (width: p = .001; depth: p = .002; area: p = .001). ***p < .001. **p < .01. *p < .05.
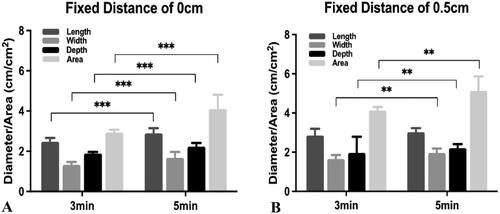
Figure 4. Comparison of the ablation zones in the specimens and hematoxylin and eosin tissue taken from different areas using a light microscope (×200). (A) Normal liver. (B) Vascular wall. (C) Central ablation zone. (D) Peripheral ablation zone. All specimens were obtained 24 h after ablation.
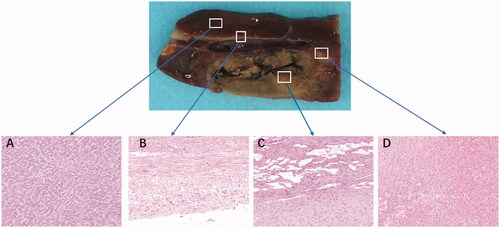
Figure 5. Pathological staining and TUNEL immunofluorescence staining results of beagle liver vessels. Results of pathological staining with hematoxylin and eosin (HE), staining with DAPI (blue), co-stained with TUNEL (green representing apoptosis) and merging (blue and green) (from the first column to the fourth column) (×50). The vascular wall cells are still well-formed in (A–D). The vascular wall is damaged in (E–H). The thrombus is observed in (I–L).
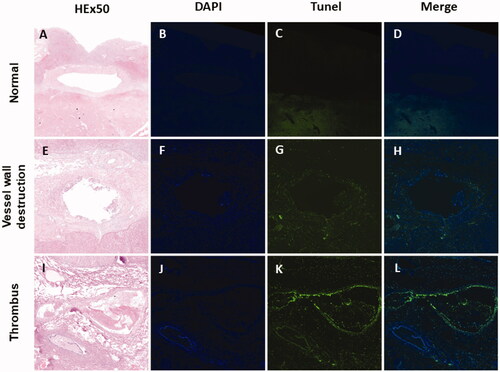
Table 2. Pathological evaluation of the vessels.