
Figures & data
Figure 1. A colorectal liver metastasis abutting right hepatic vein treated by combination of percutaneous transhepatic venous temporary balloon occlusion of the right hepatic vein and microwave ablation to compensate the heat-sink phenomenon. (A) Magnetic resonance imaging demonstrating a tumor (arrow) abutting right hepatic vein (arrowheads); (B) Percutaneous transhepatic hepatic venography demonstrating the right hepatic vein (arrows); (C) Intra-procedural CT depicting inflated balloon catheter in the right hepatic vein during ablation; (D) A Clear ablation zone (arrow) covering the right hepatic vein, which is indicated by the catheter (arrowheads); (E) One month follow-up CT revealing satisfactory ablation zone (arrow) without residual tumor; (F) CT coronal multiplanar reconstruction demonstrating the ablation zone (arrow) and patent right hepatic vein (arrowheads).
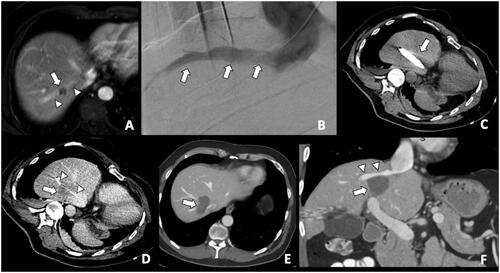
Table 1. Patient’s factors affecting oncological outcomes.
Figure 2. CT during hepatic arteriography (CTHA) on a patient with colorectal liver metastasis undergoing liver ablation. (A) CTHA prior to MWA antenna placement to localize target tumor (*); (B) postablation CTHA demonstrating large ablation zone (dotted line) around the treated tumor, which is no longer visualized; (C) 32-months CT follow-up demonstrating involution of the ablation zone without recurrence (*).
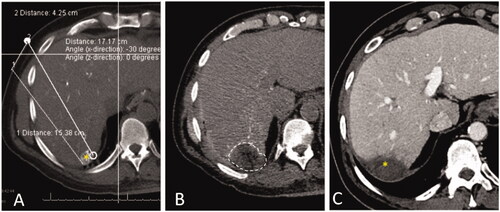
Figure 3. Stereotactic navigation systems on a patient with colorectal liver metastasis (CLM) undergoing liver ablation. (A) Posthepatectomy recurrent CLM measuring 5 cm in diameter (*); (B) Planning of 13 percutaneous guide needles trajectories, represented by different lines; (C) CT evaluation of guide needles placement (*); (D) Postablation CT for treatment verification. (E) Fusion of pre- and post-ablation CT for verification of ablation margin, showing complete tumor coverage with ablation with sufficient ablation margin.
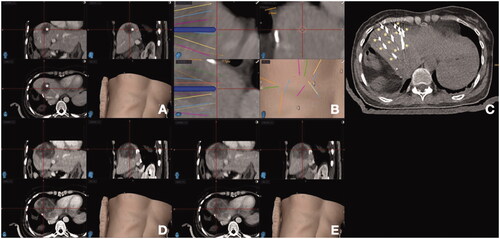
Figure 4. Kaplan–Meier curves for local tumor progression-free survival according to RAS and minimal ablation margin. RAS-wt: RAS wild-type; RAS-mt: RAS mutant. Adapted from Calandri M, Yamashita S, Gazzera C, Fonio P, Veltri A, Bustreo S, et al. Ablation of colorectal liver metastasis: Interaction of ablation margins and RAS mutation profiling on local tumor progression-free survival. Eur Radiol. 2018;28(7):2727–2734. Used with permission.
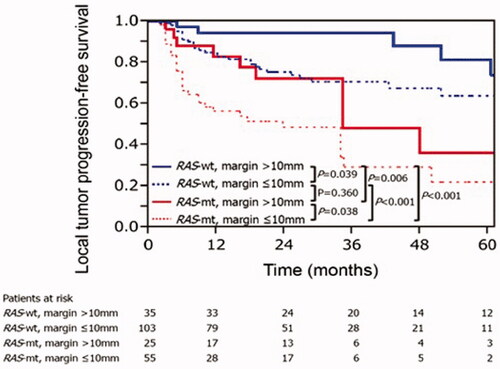
Figure 5. Importance of a deformable registration model use for assessing ablation margins. (A) 3 D CT reconstructionu using a rigid registration model. Gross tumor volume (GTV, red) is depicted onto the postablation CT maps within the ablation zone (green area); (B) 3 D CT reconstruction using a deformable registration model depicting GTV (yellow) in close contact with the ablation zone margin (green area) caudally, reflecting insuficient ablation margins (2 mm) at that region; (C) 6-month postablation 3 D CT reconstruction using a deformable registration depicting local tumor progression (purple area) and the caudal aspect of the ablation zone (green area), which was deemed to have insufficient ablation margins per biomechanical deformable registration model. Courtesy: Brian Anderson, PhD and Kristy Brock, PhD.
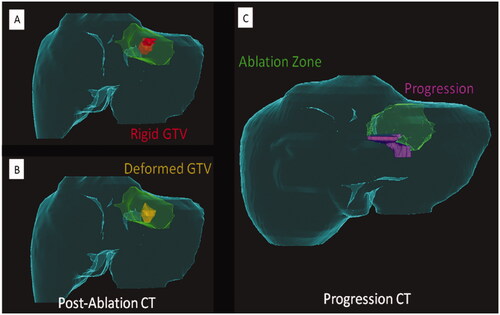
Figure 6. Assessment flowchart per-tumor of COLLISION trial. Adapted from Nieuwenhuizen S, Puijk RS, van den Bemd B, et al. Resectability and Ablatability Criteria for the Treatment of Liver Only Colorectal Metastases: Multidisciplinary Consensus Document from the COLLISION Trial Group. Cancers (Basel). 2020;12(7):1779. Published 2020 Jul 3.
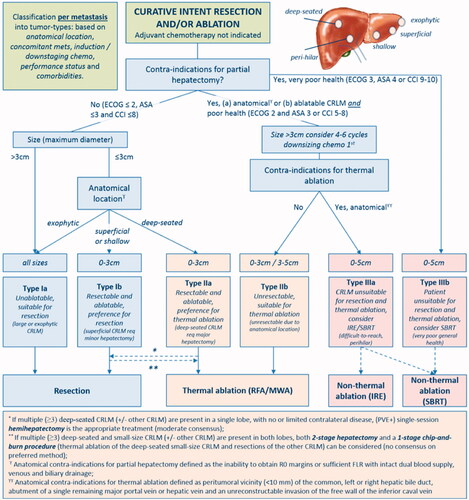
Figure 7. Flow diagram of study procedure from COLLISION trial. Adapted from Puijk RS, Ruarus AH, Vroomen LGPH, et al. Colorectal liver metastases: surgery versus thermal ablation (COLLISION) - a phase III single-blind prospective randomized controlled trial. BMC Cancer. 2018;18(1):821. Published 2018 Aug 15.
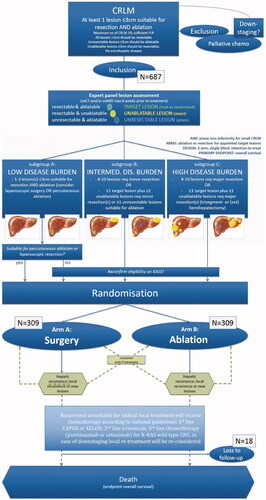
Table 2. Selected recently published relevant ablation studies.