
Figures & data
Figure 1. Treatment schedule. X – when cisplatin; 5-Fu, Docetaxel given; W – when WBH given; R – when RT given.
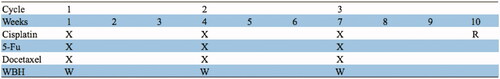
Figure 2. Picture of the heat device. (a) Schematic diagram of hyperthermia machine; (b) Patient undergo whole body hyperthermia; (c) The whole body hyperthermia machine we used. The infrared heating equipment is in the arc-shaped part, and the radiofrequency heating plate is in the couch.
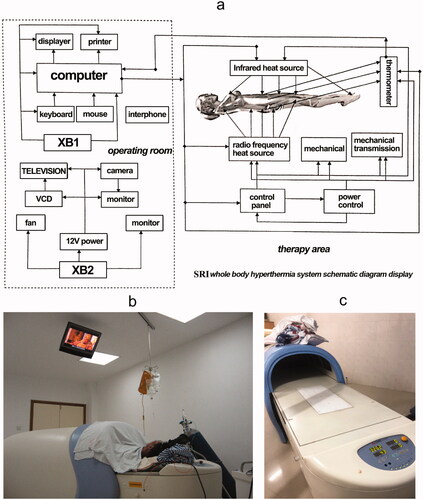
Figure 3. The whole body hyperthermia treatment curve of one patient. The upper figure is the temperature curve. The below figure is the power curve of the same patient.
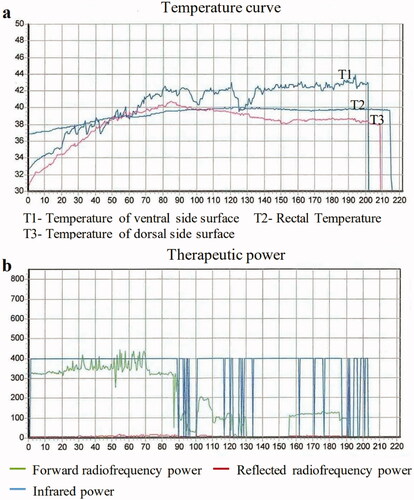
Figure 4. Changes of vital signs during WBH of 46 patients. Each dot represents an average for each patient. (a) Changes of rectal temperature. (b) Changes of Heart rate with time; (c) Changes of pulse pressure.
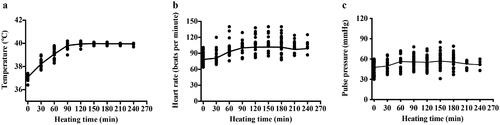
Figure 5. Kaplan–Meier survival analysis of the propensity-matched cohort of 92 patients. p Values were calculated using the log-rank test. DMFS: distant metastasis-free survival; LRRFS: local-regional recurrence-free survival; OS: overall survival; PFS: progression-free survival.
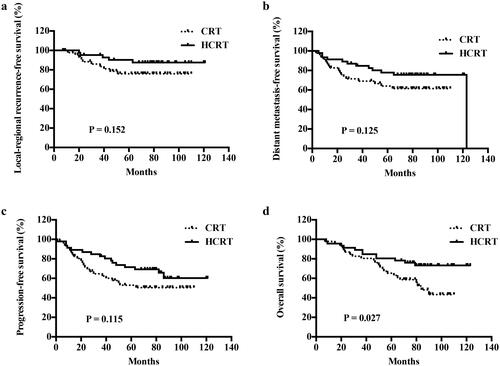
Table 1. Baseline characteristics of patients before and after propensity score matching.
Table 2. Multivariable analysis to identify independent predictors of overall survival based on propensity score-matched patients.
Table 3. Cumulative grade 3–4 adverse events [n (%)] during treatment, based on propensity score-matched patients.