
Figures & data
Figure 1. The cases for delineating ROI. The preoperative MR images for uterine leiomyomas received NPV ratios ≤50%, 50–80% and ≤80% after HIFU ablation on (a–c) T2W images and (d–f) ADC maps.
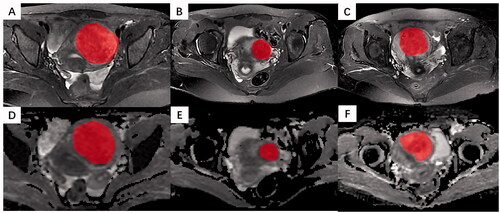
Figure 2. The flowchart of machine learning model construction.
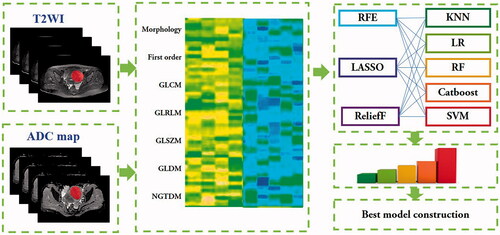
Table 1. The comparison of demographic information and radiological characteristics between the training and testing cohorts.
Table 2. The clinical and radiological characteristics among NPV ratio classification groups.
Figure 3. The performance of radiomics models constructed by different combinations of feature selection algorithms and machine learning classifiers in the training cohort.
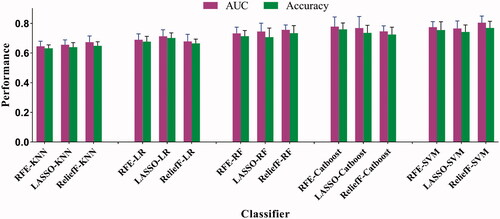
Figure 4. The average AUC shown by ROC curves for clinico-radiological model, radiomics model, and radiomics-clinical model in predicting NPV ratio classification for (a) the training and (b) testing cohorts.
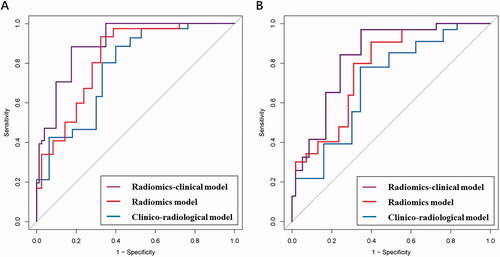
Table 3. The performance of clinico-radiological model, radiomics model, and radiomics-clinical model in predicting NPV ratio classification.
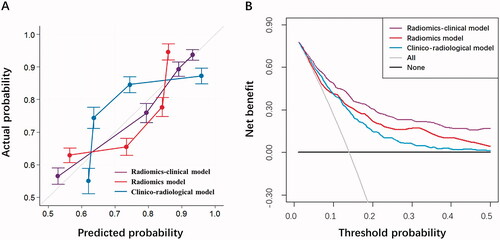
Figure 5. Further model performance evaluation by (a) calibration curve analysis in terms of the agreement between the predicted and actual probability and (b) decision curve analysis in terms of net benefit for the clinico-radiological model, radiomics model, and radiomics-clinical model in the testing cohort.
Data availability statement
The data used to support the findings of this study are available from the corresponding author upon request