
Figures & data
Figure 1. Routine pre-procedural disinfection preparation.
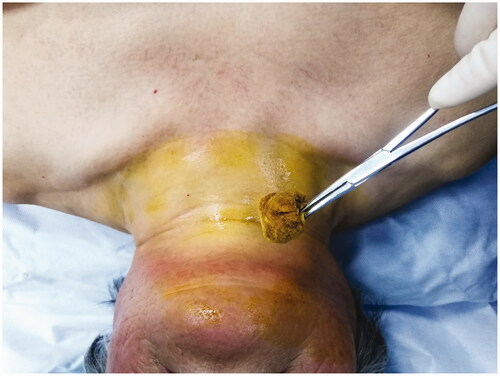
Figure 2. Injection of isolation fluid to achieve water separation between the thyroid and adjacent tissues.
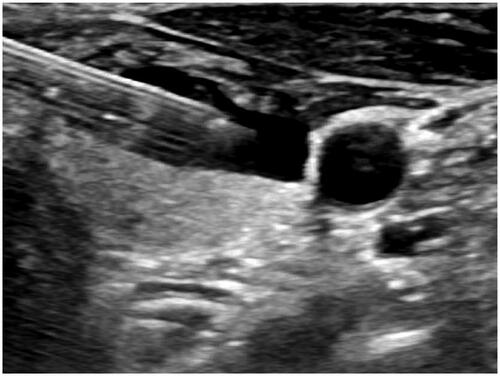
Figure 3. Pre-procedural, procedural, and post-procedural images. (a) Pre-procedural nodule localization. The solid nodule is located in the middle and upper part of the right lobe of the thyroid, with the size of 0.42 × 0.38 × 0.35 cm3. It is hypoechoic, irregular in shape, unclear in boundary, aspect ratio >1, and has no calcification. (b) Pre-procedural contrast-enhanced ultrasound (CEUS). The nodules show low enhancement. (c) Picture of the MWA process. The ablation area is shown as a bubble-like hyperecho. (d) Post-procedural CEUS. The MWA range is significantly larger than that of the tumor.
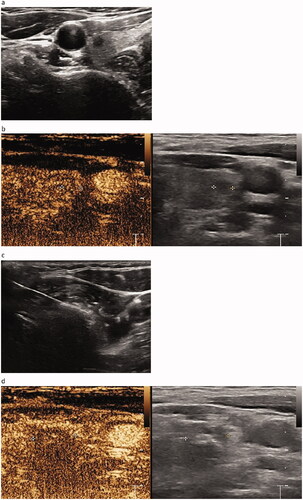
Figure 4. The MWA procedure.
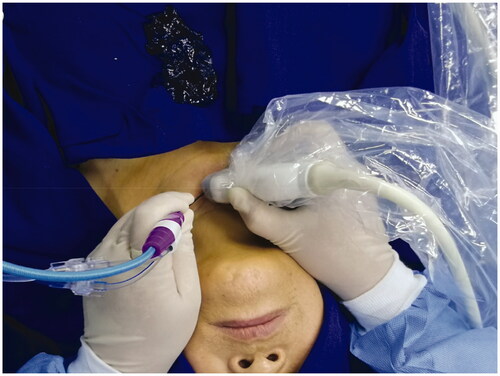
Figure 5. Size of the ablation area at (a) 1, (b) 3, (c) 6, and (d) 12 months after MWA. Well-treated tumors exhibiting changes to a hypoechoic nature, marked decrease in size, and loss of internal vascularity on Doppler US. The volume of the nodule is measured from 0.158 cm3 immediately after MWA to completely disappear at 12 months, and the volume reduction rate (VRR) is 100%.
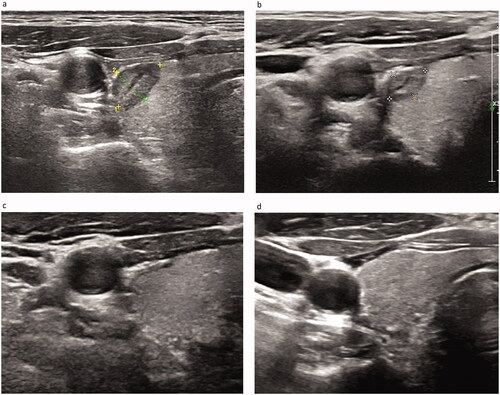
Table 1. Demographic characteristics and ultrasonographic manifestations of the subjects.
Figure 6. Maximum diameter of the pre-procedural nodule and ablation area immediately after MWA and at 1, 3, 6, 12, 18, and 24 months follow-up.
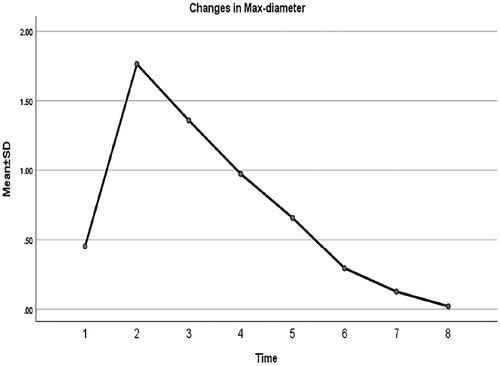
Figure 7. Volume of the pre-procedural nodule and ablation area immediately after MWA and at 1, 3, 6, 12, 18, and 24 months follow-up.
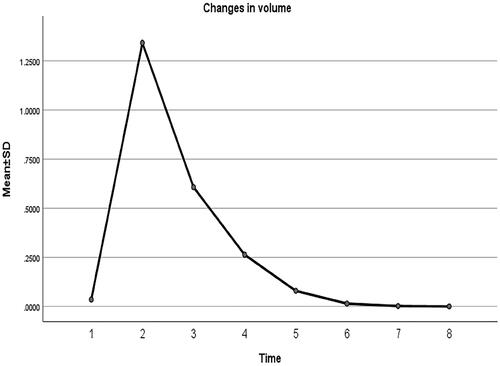
Figure 8. Volume reduction rate of the ablation area immediately after MWA and at 1, 3, 6, 12, 18, and 24 months follow-up.
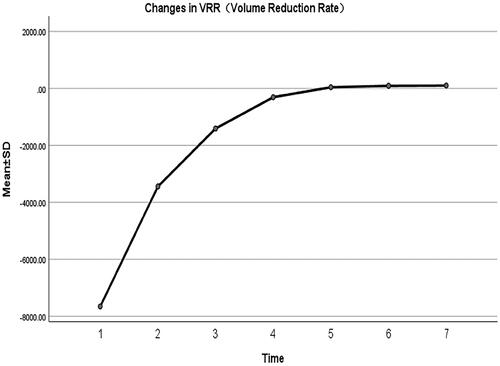
Table 2. Changes in maximum diameter of nodules at each follow-up after MWA.
Table 3. Changes in AAV and VRR at each follow-up after MWA.
Table 4. Comparison of complications between ablation group and surgery group.
Table 5. Overall comparison between ablation group and surgery group after the procedure.