
Figures & data
Figure 1. Flowchart of patient enrollment.
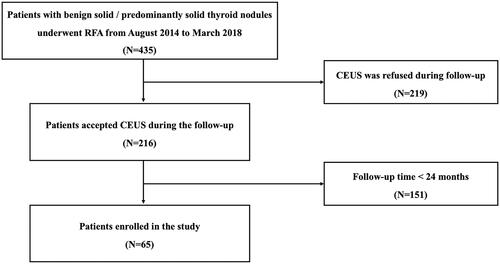
Figure 2. The measurement of ablated volume (Va) on CEUS images after RFA. (A, C) The longitudinal and transverse CEUS images showed Va present as a nonenhanced zone during arterial phase and venous phase. (B, D) Diagrams showed the measurement method of Va by CEUS.
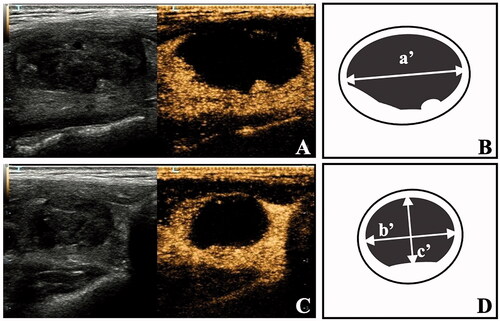
Table 1. Clinical characteristics of patients before RFA.
Table 2. Changes of the volume and VRR after RFA at each follow-up.
Figure 3. CEUS and US images of a 33-year-old female with a benign thyroid nodule after RFA. (A) Before RFA, US image showed a predominantly solid thyroid nodule located in the right lobe with an initial volume of 5.32ml. (B) At 1 month after RFA, Vt and Va were 1.58 ml and 1.41 ml, respectively. (C) At 3 months after RFA, Vt and Va were 0.88 ml and 0.73 ml, respectively. (D) At 6 months after RFA, Vt and Va were 0.75 ml and 0.63 ml, respectively. (E) At 12 months after RFA, Vt and Va were 0.32 ml and 0.21 ml, respectively. (F) At 24 months after RFA, Vt and Va were 0.18 ml and 0.08 ml, respectively.
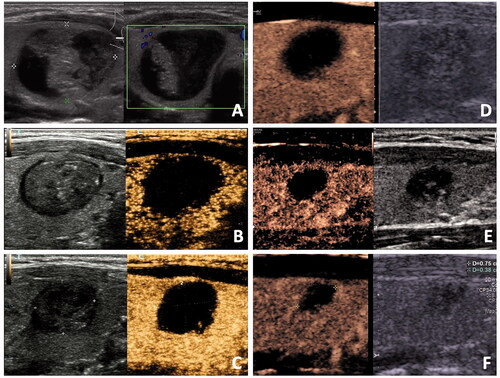
Table 3. The measurement of Va by CEUS.
Table 4. The intra- and inter-observer reliability of the measurement of Va.
Figure 4. Bland-Altman plots of Va measurement by the two observers at 1, 3, 6, 12, 24 and 36 months after RFA were shown from(A) to (F). The x-axes showed the average of Va measurements by the observers. The y-axes showed the ratio between the observers. Solid lines were the mean difference(bias). Top and bottom dashed lines correspond to upper and lower margins of 95% limits-of-agreement (LOA).
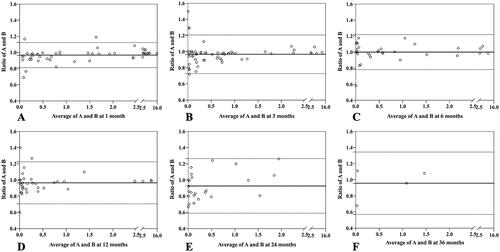
Table 5. Inter-observer agreement of Va by the Bland–Altman analysis.