
Figures & data
Figure 1. The process of patient selection was shown, with the final number of patients as 330.
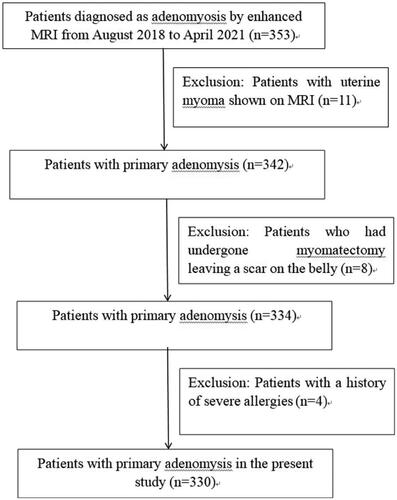
Table 1. Basic information and treatment data of patients.
Figure 2. Before HIFU ablation, the lesion of adenomyosis is in the posterior wall of uterus with low echo (A). After HIFU ablation, the echo of adenomyosis turns white(B); Before HIFU, the T2WI MRI shows the adenomyosis in the posterior wall of the uterus with hypointensity signal and hyperintensity pot sac signal (C); On contrast enhanced magnetic resonance imaging after treatment, the non-perfused volume (arrows) in the posterior wall is necrosis of the adenomyosis (D).
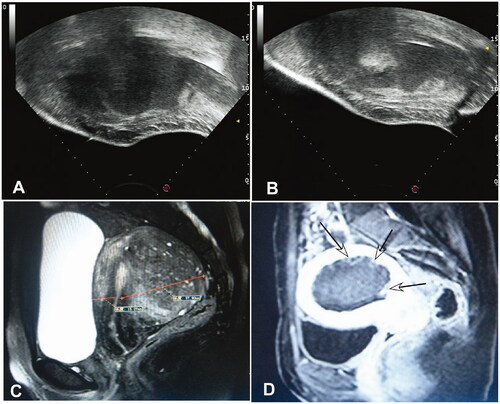
Figure 3. The high-intensity focused ultrasound (HIBU) ablation time, EEF (energy efficiency factor), NPVR (non-perfused volume ratio), and VAS (Visual Analogue Scale) were shown among four groups. (A) A significant (p < 0.05) difference existed in the HIFU ablation time between group A and each of the other three groups (*) or between groups B or C and group D (**). (B) A significant (p < 0.05) difference existed in EEF between group A and each of the other three groups (*) or between groups B or C and group D (**). (C) A significant (p < 0.05) difference existed in NPVR between group A and group D (*). (D) No significant (p > 0.05) difference was found in VAS among four groups. *Indicates a significant (p < 0.05) difference between group A and the other groups in figures A and B or between groups A and D in figure (C). ** indicates a significant (p < 0.05) difference between group B or C and group D.
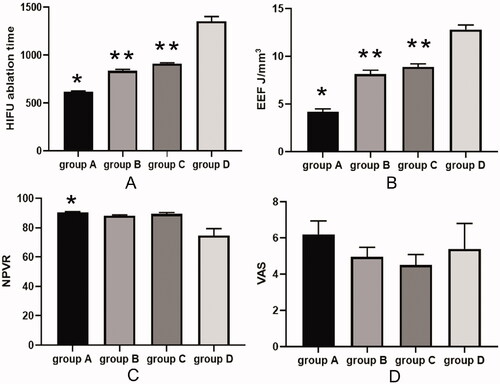
Table 2. Tests of effects between subjects with ablation time as the dependent variable.
Table 3. Complications of HIFU treatment for adenomyosis.
Data availability statement
All data and materials analyzed in this study are included in the manuscript. The data used and/or analyzed in the current study are available from the corresponding author on reasonable request.