Figures & data
Figure 1. Schematic illustration of the ExAblate body phased-array transducer, with a spherically curved geometry including 8 sectors and 26 concentric rings, with equal surface area maintained for each of the 208 elements. Apart from phasing patterns, the illumination can be adjusted from 100% (a) to approximately 60% active elements (b) effectively reducing the aperture from 120 to 94.6 mm diameter.
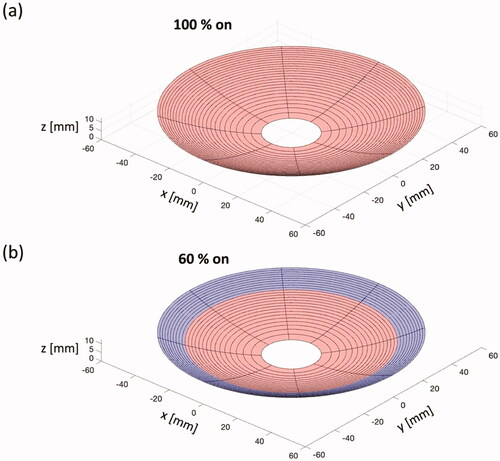
Figure 2. Conceptual diagram of sonications with electronic beam steering. (a) Electronic beam steering with a single focus along the z- and x-direction on an MR magnitude image. (b) Illustration of a sonication cell rapidly sweeping a single focal spot across four focal points. (c) top view of phase distribution steered along the z-axis and (d) phase distribution steered to 3 mm along the x-axis. (e, f) Top view of the phase distribution of transducer according to the vortex modes 2 and 4.
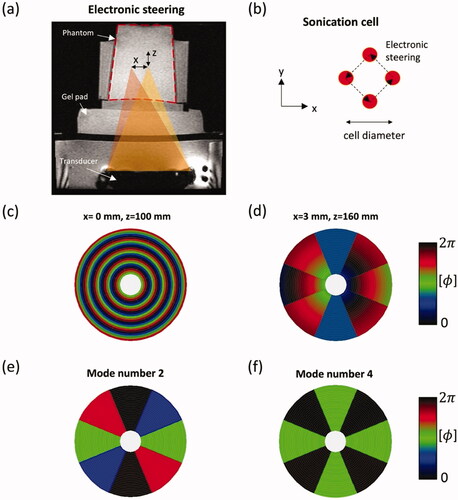
Table 1. Parameters of acoustic and thermal tissue properties representative of general soft tissue used for the simulation studies [Citation36].
Table 2. Acoustic power and duration applied in experiment 3.
Figure 3. Results of experiments 1 and 2 for sonications using the electronic beam steering. (a) Normalized acoustic intensity at (x–z) plane, obtained by 100% (top) and 60% (bottom) of array elements. MR temperature images for steering of 10 mm are shown when the maximum temperature of 3 is reached. (b) Temperature distributions with MR thermometry for a sonication cell rapidly sweeping a single focal spot. Sonication cells have a diameter ‘d’ of 12 and 20 mm at the focal depth of 130 mm (top) and 160 mm (bottom), respectively. The red dashed line indicates the boundary of the phantom: longitudinal slice (left) and transverse slice (right). A black solid line shows a boundary of an area above a temperature rise of 4
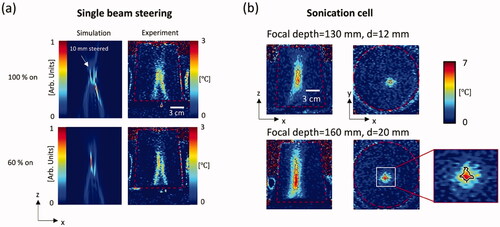
Table 3. Summary of temperature metrics for the electronic beam steering (experiment 2) and the vortex beam mode (experiment 3) approaches.
Figure 4. Longitudinal normalized intensity fields (top row) and simulated temperature distributions (bottom row) for vortex beam modes 0, 2, and 4 as well as mode 4 with 80% and 60% partial elements (PE). The black solid line (top right) indicates a boundary of half of the maximum in the acoustic intensity and the red dashed line indicates the width of the boundary.
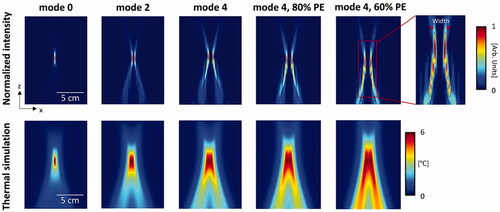
Figure 5. Temperature distributions with MR thermometry for phantom experiments using the vortex beam modes 0 and 4 with 100%, 80%, and 60% partial elements (PE). Sonications were applied at the focal depth of 100 mm (top row), 130 mm (center row), and 160 mm (bottom row). Red dashed line indicates the position of phantom. A black solid line indicates an area of temperature rise above 4 (top right).
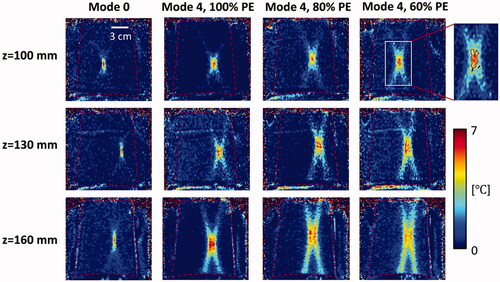
Figure 6. Effects of the vortex modes 0, 4 and partial array elements (PE) on lateral width in simulation (a) and experiment (b), axial length (experiment, c), as well as estimated volume (experiment, d), as measured for the area of temperature rise above 4

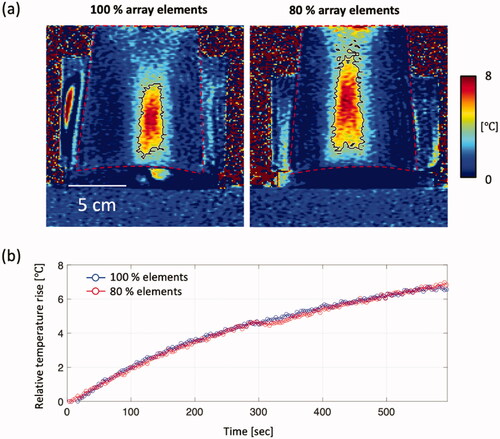
Figure 7. Volumetric HT distributions in the phantom comparing 100% and 80% array activation. (a) Temperature maps at 600 s are shown and (b) time-dependent profiles of temperature measured in an ROI at the focus is plotted. A black solid line in the MR temperature map indicates an area for a temperature rise above 4