Figures & data
Figure 1. Quantitative assessment of treatment outcome post-TULSA. The desired ablation volume (orange line) is contoured from a high-resolution, transverse T2w treatment planning sequence, which was acquired through the prostate (a). Once contoured, the treatment objective is to deliver at least 240 cumulative equivalent minutes (CEM) to the prescribed boundary volume. A quantitative assessment of treatment outcome can be performed immediately post-treatment through inspection of cumulative thermal dose map (b). A small amount of undershoot can be seen on the patient’s right, near the base (red arrow), where the dose fails to reach the boundary. Undershoot can potentially change the follow-up care strategy due to residual cancer.
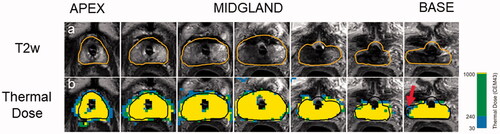
Figure 2. Measurement of thermal undershoot attributable to marker. On each post-treatment thermal dose map, the angular region affected by each fiducial marker was calculated (a). For this specific angular region (b), the target boundary (black) was compared to the isodose boundary (red). If the black target boundary is larger than the red isodose boundary, this is considered thermal undershoot.
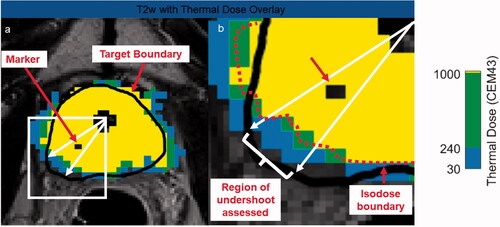
Figure 3. Distribution of markers inside the prostate relative to prostatic urethra center and prostate capsule.
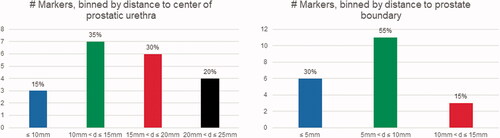
Figure 4. Case examples demonstrating different effects markers can have on thermal dose. Marker centers are shown with red arrows. Despite the presence of a gold marker, the thermal dose extends to the prescribed boundary (a). The large susceptibility artifact caused by the nitinol marker forced the user to move the target boundary (black) inside the actual prostate boundary (white), due to high temperature uncertainty (b). After focal treatment of patient’s right lobe, which was drawn outside the prostate capsule to include the neurovascular bundle, undershoot is caused by the gold marker located 9.1 mm from the urethra center and 14 mm from the target boundary. A gold marker situated close to the urethra center (12.4 mm) but far from the target boundary (13.5 mm) impeded the ultrasound wave resulting in poor thermal dose delivery inside the prostate (d).
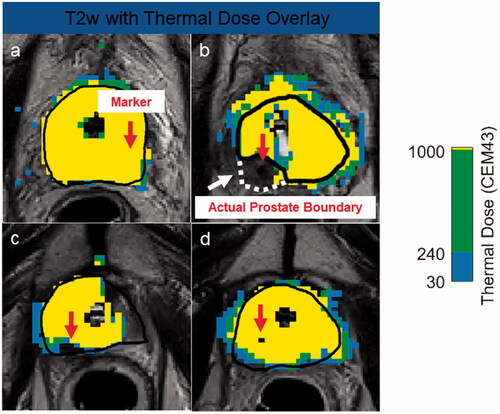
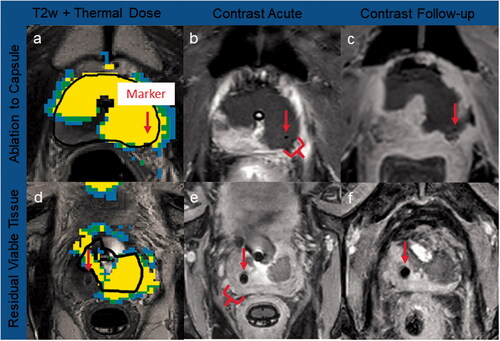
Figure 5. Case examples of thermal dose and contrast-enhanced imaging. Marker centers are shown with red arrows. Ablation to capsule: a gold marker located did not impact ultrasound heating, with thermal dose (a) accumulating to the prostate capsule, and no residual tissue post-TULSA confirmed on acute (b) and 3-month CE imaging (c). Residual viable tissue: significant amounts of prostate tissue were left outside treatment field due to thermometry contamination from the nitinol artifact, leading to extensive undershoot behind the marker (d), confirmed on acute (e) and 8-day CE imaging (f).