Figures & data
Figure 1. Coronal maximum intensity projection (MIP) [Citation25] illustrating arterial and venous locations where imaging data were acquired and quantified.
![Figure 1. Coronal maximum intensity projection (MIP) [Citation25] illustrating arterial and venous locations where imaging data were acquired and quantified.](/cms/asset/02e5dd9d-9413-49db-9ad8-985c8134a50f/ihyt_a_2018510_f0001_b.jpg)
Figure 2. Volumetric flow averaged across the cardiac cycle (mean ± SEM) in the neck and torso vessels of male and female, adult and aged mice (n = 5 each) at core temperatures of 35, 36, 37, and 38 °C. Response varied by location and across sex and age. Significance set at p < .05 for: temperature effect overall (†); pairwise comparisons between temperatures within a group(#); relative changes between same age group but opposite sex ($) and same sex but different age group (@), non-zero slope (*). Bold and underlined denotes p < .01.
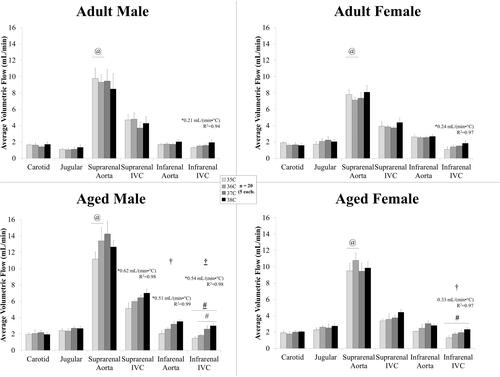
Figure 3. Volumetric flow averaged across the cardiac cycle (mean ± SEM) in the peripheral vessels for male and female, adult and aged mice (n = 5 each) at core temperatures of 35, 36, 37, and 38 °C. Response varied by location and across sex and age. Significance set at p < .05 for: temperature effect overall (†); pairwise comparisons between temperatures within a group (#); relative changes between same age group but opposite sex ($) and same sex but different age group (@), non-zero slope (*). Bold and underlined denotes p < .01.
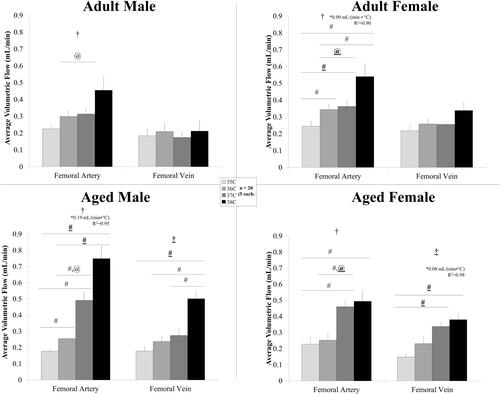
Figure 4. Average velocity across the cardiac cycle (mean ± SEM) in the arteries for male and female, adult and aged mice (n = 5 each) at core temperatures of 35, 36, 37, and 38 °C. Response varied by location and across sex and age. Significance set at p < .05 for: temperature effect overall (†); pairwise comparisons between temperatures within a group (#); relative changes between same age group but opposite sex ($) and same sex but different age group (@), non-zero slope (*). Bold and underlined denotes p < .01.
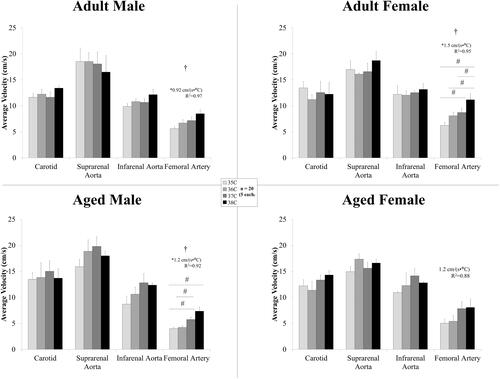
Figure 5. Average velocity across the cardiac cycle (mean ± SEM) in the veins for male and female, adult and aged mice (n = 5 each) at core temperatures of 35, 36, 37, 38 °C. Response varied by location and across sex and age. Significance set at p < .05 for: temperature effect overall (†); pairwise comparisons between temperatures within a group (#); relative changes between same age group but opposite sex ($) and same sex but different age group (@), non-zero slope (*). Bold and underlined denotes p < .01.
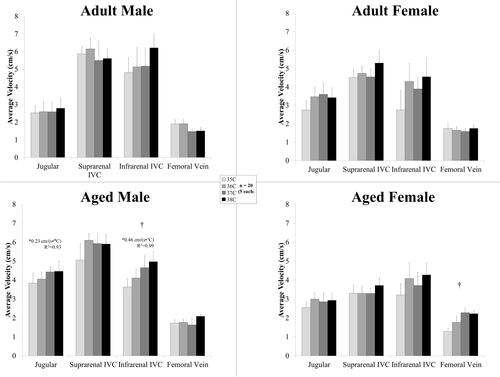
Table 1. A summary of the mean velocity (cm/s) at peak systole and end diastole for all animal groups at every location. Data presented as mean ± standard error (SEM).
Figure 6. For standard viscosity (0.04 dyne sec/cm2) across temperature, wall shear stress averaged across the cardiac cycle (mean ± SEM) in the arteries for male and female, adult and aged mice (n = 5 each) at core temperatures of 35, 36, 37, and 38 °C. Response varied by location and across sex and age. Significance set at p < .05 for: temperature effect overall (†); pairwise comparisons between temperatures within a group (#); and, non-zero slope (*). Bold and underlined denotes p < .01.
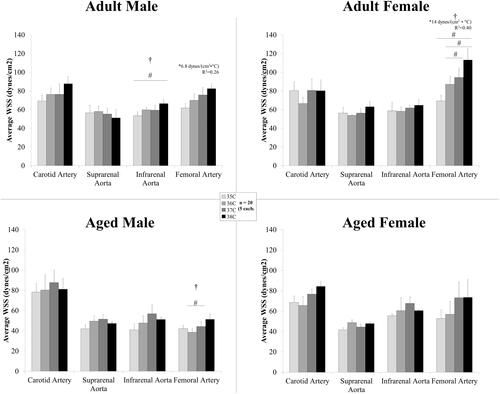
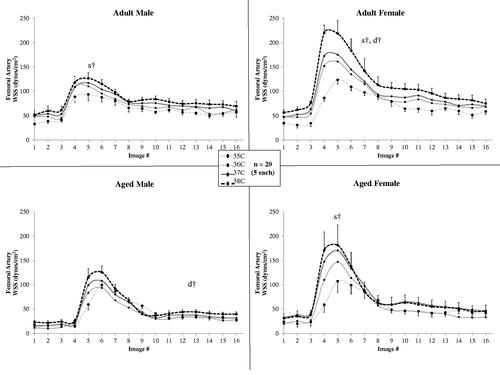
Figure 7. For standard viscosity (0.04 dyne sec/cm2) across temperature, wall shear stress plotted across the cardiac cycle in the femoral artery for male and female, adult and aged mice (n = 5 each) at core temperatures of 35, 36, 37, and 38 °C. Error bars shown only for 38 C and 35 C for clarity. Significance set at p < .05: for temperature effect overall at mean systole (s†) and mean diastole (d†).
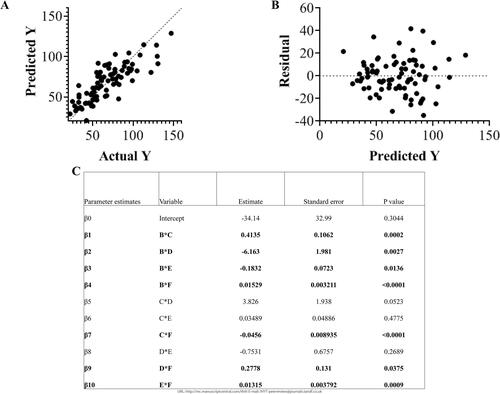
Figure 8. Multivariable regression analysis with two-way interactions for wall shear stress (Y) in the femoral artery (R2 = 0.68, p < .0001) with variables B: temperature, C: body weight, D: sex (1 male or 0 female), E: age (in weeks), F: heart rate: Y = β0 + β1*B*C + β2*B*D + β3*B*E + β4*B* F + β5*C*D + β6*C*E + β7*C*F + β 8*D*E + β9* D*F + β10*E*F. A. Plot of predicted Y versus Actual Y B. Plot of residuals for multivariable regression analysis model. C. Table of parameter estimates and p-values. Significance set at p < .05.