
Figures & data
Figure 1. MR T1-weighted gradient recalled echo 3 D images. Left: Phantom with air bubbles. Right: Phantom without air bubbles. 1. Agarose-based matrix gel. 2. Agarose and condensed milk strands for fluid perfusion. 3. Ultrasound coupling gel. 4. Water. 5. HIFU transducer.
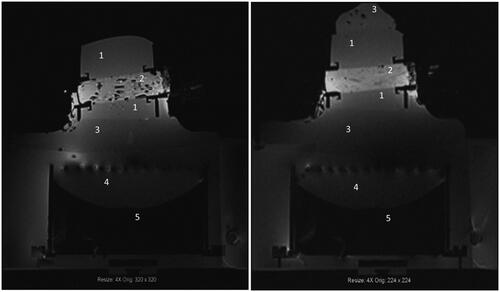
Figure 2. (A) Depiction of relationship between droplet physical surface and theoretical interaction radius. (B) Interaction regime represented as a one-dimensional normal distribution of probability (P) for acoustic energy transformation into heat.
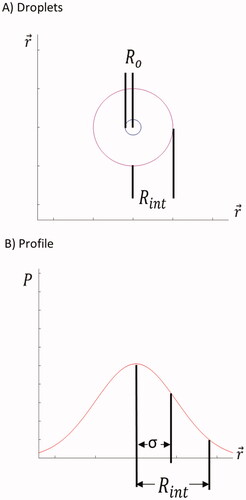
Figure 3. Depiction of theories for overlapping interaction regimes. Red lines represent individual heating regimes. Green lines represent effective regimes. P is the probability for acoustic energy transformation into heat.
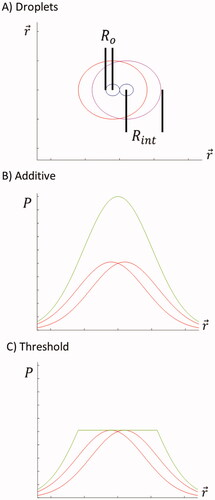
Figure 4. 3D Matrix Convolution. A zeros matrix was generated. Then values of 1 were inserted at random coordinates. Next, the binary matrix was convolved with a Gaussian kernel. The output matrix has Gaussian elements placed at each location the values of 1 were located. Inherent to convolution, overlapping Gaussians were superimposed, additively. The final matrix was set to a threshold value equal to the maximum of the Gaussian distribution.
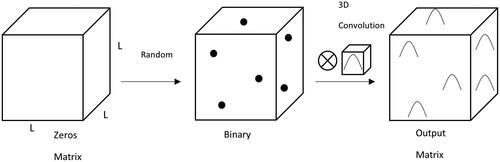
Figure 5. 2D median section through the 3D volume of simulation used to create a data point for the simulation results in , with 250 nm resolution and 0.04% v:v droplets. Shown FOV is 250 µm. The interaction radius increases at (a) 7.5 µm, (b) 12.5 µm, (c) 17.5 µm, and (d) 22.5 µm, respectively. Nonlinear threshold-based 3D summation of overlapping probabilities was applied, see . Note the saturating effect from adjacent droplets in particular for larger interaction radii.
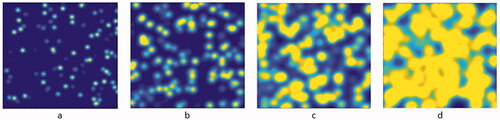
Figure 6. Acoustic absorption coefficient measurements for a series of perfusate emulsion concentrations and focused ultrasound sonication conditions. The values illustrated relative to baseline for the control condition without droplets present and normalized to overall maximum.
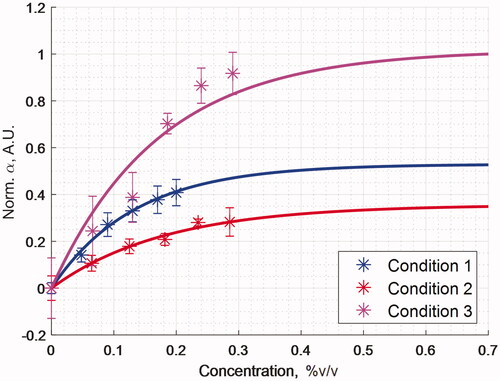
Figure 7. Gaussian Kernel Simulations for a 1024x1024x1024 Matrix. Solid lines represent an interaction radius that is equal to 2.5 standard deviations of a spherical Gaussian distribution. These were normalized to the maximum possible attenuation in the simulation volume. The points represent the first order exponential fit line through the experimental data that has been normalized to the horizontal asymptote.
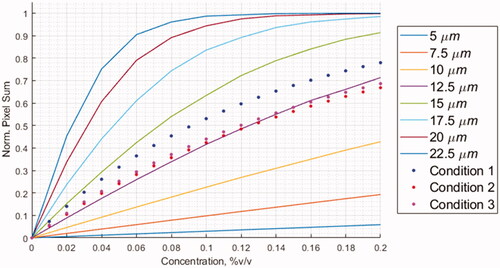
Table 1. Sonication parameters, empirical fit constants, and model interaction radius comparison.