Figures & data
Figure 1. Patient inclusion flowchart.
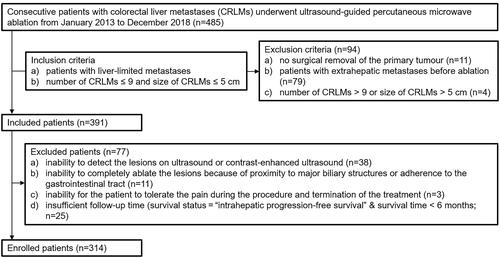
Table 1. Characteristics of the patients.
Figure 2. Overall survival and intrahepatic progression-free survival of patients.
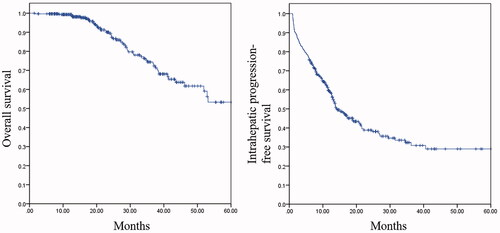
Table 2. Univariable analyses of factors associated with intrahepatic disease progression.
Table 3. Multivariable analyses of factors associated with intrahepatic disease progression.
Figure 3. Prognostic nomogram for predicting the ihPFS of patients with CRLMs undergoing MWA. To use the nomogram, draw a line straight upward to the points axis at the same vertical position for each variable. Sum the points achieved for each predictor and locate this sum on the total points axis. Draw a line straight down to the ihPFS axis to find the patient’s probability of 1-, 2-, and 3-year ihPFS at the same vertical position. According to the total score, the risk group to which the patient belongs may be obtained. ihPFS: intrahepatic progression-free survival; CRLMs: colorectal liver metastases: MWA: microwave ablation; N: primary tumor lymph node status.
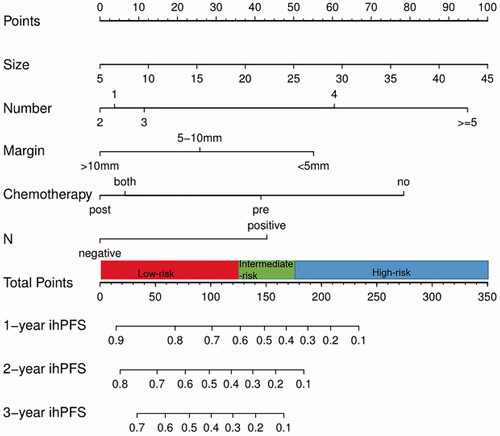
Figure 4. Calibration curves and decision curves of the nomogram. (a–c) Calibration curves showing the probability of 1-, 2-, and 3-year ihPFS between the nomogram prediction and the actual observation. Perfect prediction corresponds to a slope of 1 (diagonal 45-degree gray line). (d–f) Decision curves of the nomogram predicting ihPFS. The x-axis represents the threshold probabilities, and the y-axis measures the net benefit calculated by adding the true positives and subtracting the false positives. The horizontal line along the x-axis assumes that intrahepatic disease progression occurred in no patients, whereas the solid gray line assumes that all patients will have intrahepatic disease progression at a specific threshold probability. The dashed line represents the net benefit of using the nomogram. ihPFS: intrahepatic progression free survival.
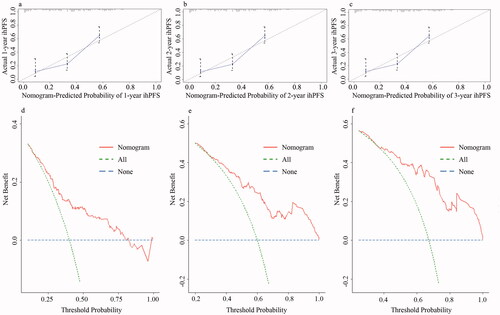
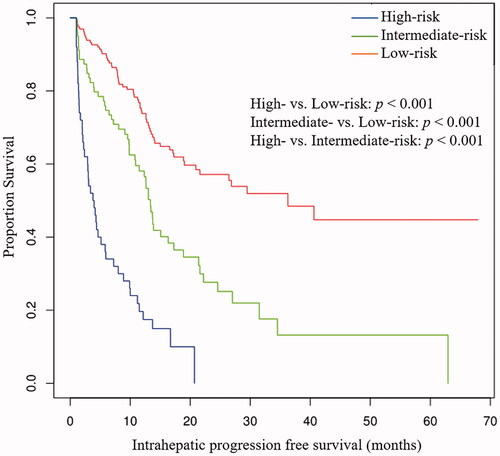
Figure 5. Kaplan–Meier curves of intrahepatic progression-free survival for patients in the low-, intermediate-, and high-risk groups. ihPFS: intrahepatic progression-free survival.