Figures & data
Figure 1. Diagrammatic representation of two different needle-tract routes (trans-thyroidal and direct approach) for percutaneous ablation. CCA: common carotid artery; IJV: internal jugular vein.
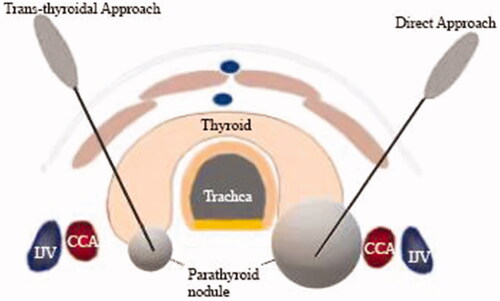
Figure 2. Flow chart of patients included in the study. sHPT: secondary hyperparathyroidism; MIBI: 99 m Tc-sestamibi; pHPT: primary hyperparathyroidism; MWA: microwave ablation; and PTX: parathyroidectomy.
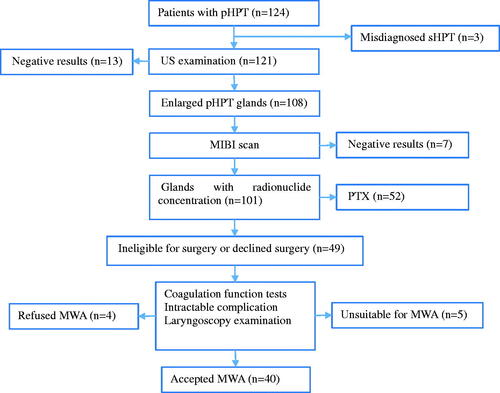
Table 1. Baseline clinical and treatment characteristics of patients with pHPT (n = 40).
Figure 3. CEUS displaying incomplete ablation in a 46-year-old woman with pHPT. (A) CEUS images immediately after MWA: non-enhancement area covers the pHPT nodule (arrows). (B) Color Doppler images 1 day after MWA: signs of punctate blood flow signals of the margin of the ablation zone (arrows). (C) CEUS images 1 day after MWA: the arterial phase demonstrates an annular enhancement area (arrows) around the ablation zone. (D) US images 1 year after ablation: the VRR of the ablation zone (arrows) is 83.6% ablation zone (arrows). CEUS: contrasted-enhanced ultrasound; pHPT: primary hyperparathyroidism; MWA: microwave ablation; VRR: volume reduction rate; US: ultrasound.
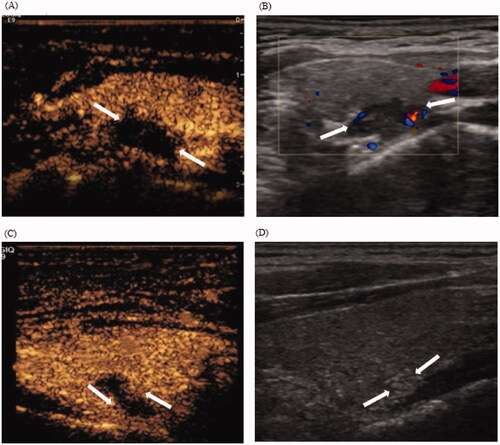
Table 2. Changes in US features and serum biochemical data before MWA and at each follow-up.
Table 3. Complications and side effects following MWA.
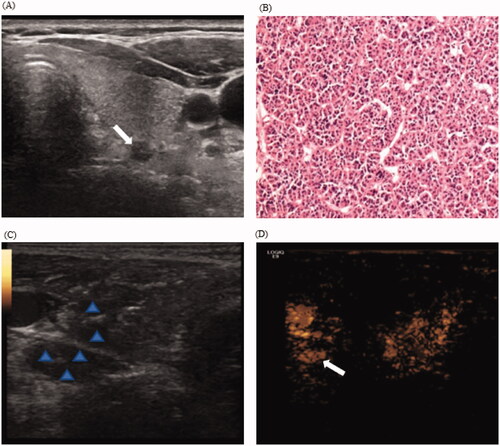
Figure 4. CEUS displaying hidden nodule during hydrodissection in a 55-year-old woman with pHPT. (A) Routine US display a hypoechoic pHPT nodule with maximum diameter of 0.5 cm; (B) Preoperative nodule FNA biopsy indicates a parathyroid adenoma with the formation of microfollicles (H&E stain, ×200). (C) During hydrodissection, nodular changes in the surrounding tissues and the pHPT nodule are hypoechoic (arrow). (D) The injection of contrast agents display the uniform enhanced parathyroid nodule (arrows). CEUS: contrasted-enhanced ultrasound; pHPT: primary hyperparathyroidism; FNA: fine-needle aspiration.