Figures & data
Table 1. Patient characteristics.
Figure 1. Median nodule volume over 4 years of follow-up. *p < 0.001 vs pretreatment nodule volume. Percentage values indicate the VRRs at each timepoint. The number of patients who underwent nodule-volume assessment at the different time points was as follows: pretreatment and 1 year, 24; 4 years, 23.
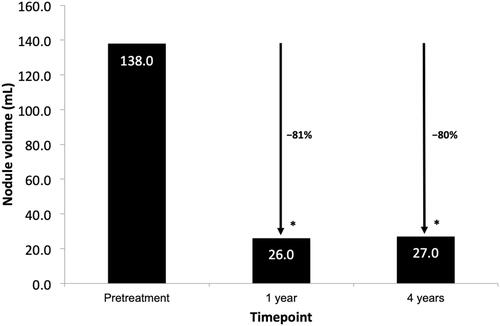
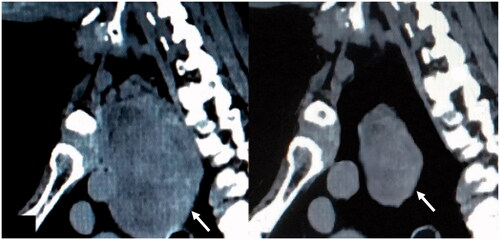
Figure 2. Example of CT scans before (left) and 6 months after (right) the last laser treatment. The thyroid nodule is indicated by the white arrows.