
Figures & data
Figure 1. (A) The therapeutic process of LIUS; (B)The method to measure the fundal height.
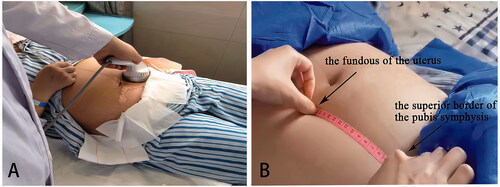
Figure 2. Flow diagram for subject selection.
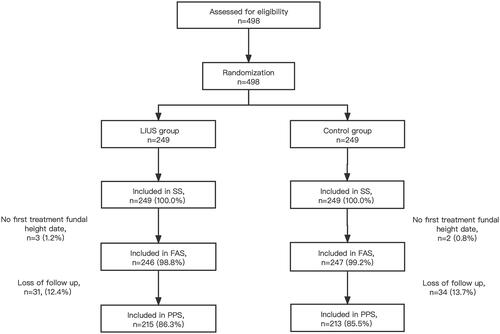
Table 1. Baseline demographic and clinical characteristics (FAS).
Figure 3. (A) FAS; (B) PPS. Fundal height changes in both groups of subjects before and after five treatments. (C) FAS; (D) PPS. Fundal height difference between the two groups of subjects before and after five treatments. (a) After ultrasound treatment; (b) before ultrasound treatment.
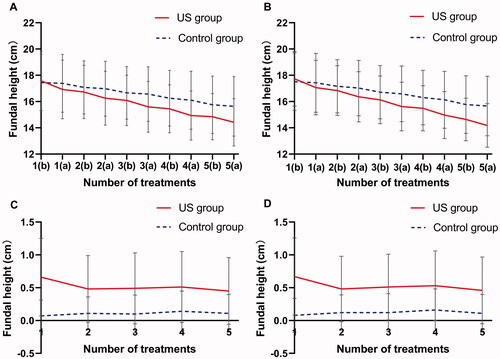
Table 2. Comparison of repeated measurement of uterine height before and after five treatments between the two groups of subjects.
Figure 4. Comparison of the effect of uterine involution between the two groups of subjects. Good uterine involution, the total duration of lochia? 42 days; Poor uterine involution, the total duration of lochia >42 days.
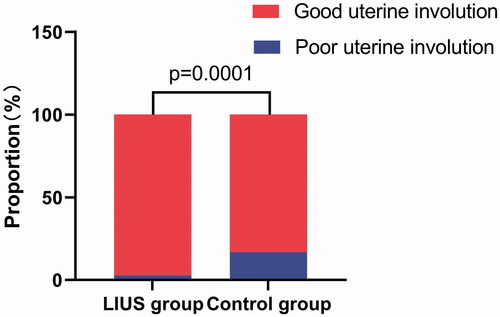
Table 3. Comparison of the total duration of lochia and the duration of bloody lochia between the two groups of subjects (PPS).
Figure 5. (A) FAS; (B) PPS. Pain VAS scores changes in both groups of subjects before and after five treatments. (C) FAS; (D) PPS. Pain VAS scores difference between the two groups of subjects before and after five treatments. (a) After ultrasound treatment; (b) before ultrasound treatment.
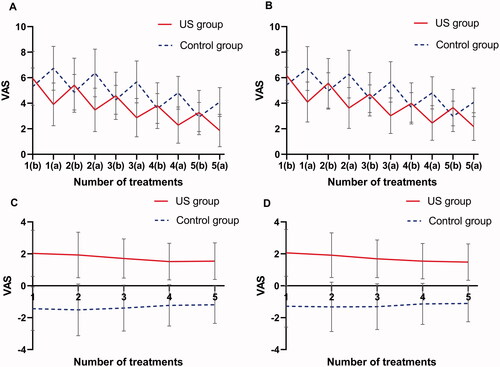
Table 4. Comparison of repeated measurement of VAS scores before and after five treatments between the two groups of subjects.