
Figures & data
Table 1. Parameters for HIPEC.
Figure 1. Schematic illustration of patient enrollment.
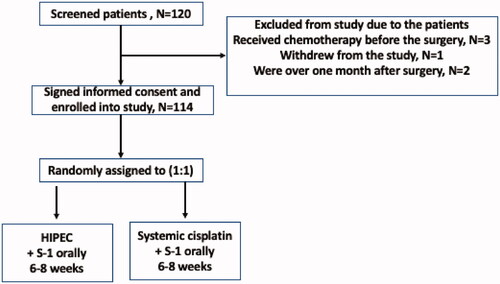
Table 2. Demographic characteristics of the participants.
Table 3. Treatment cycles.
Figure 2. Kaplan–Meier plot of disease-free survival (Panel A) and overall survival (Panel B) for the patients.
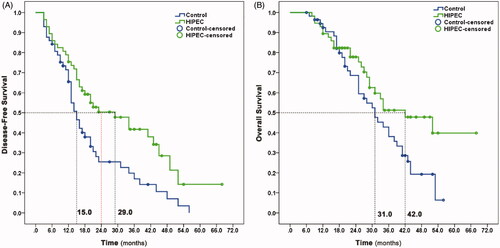
Table 4. Comparison of adverse events in the two groups.
Table 5. HIPEC-associated side effects.
Data availability statement
All data generated in this study were included in this published article.