Figures & data
Table 1. Key-words for query construction, divided by areas of interest.
Figure 1. Flow chart of the present systematic literature search.
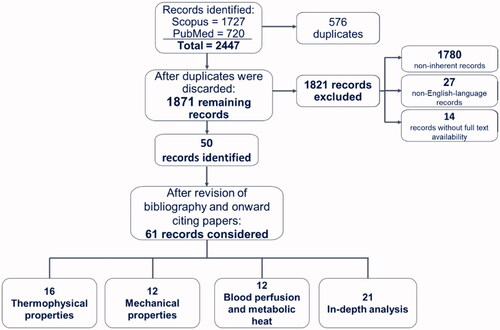
Figure 2. Techniques used for measuring thermal properties of biological tissues as temperature varies: setup and equipment. (a) Setup used to measure thermal properties with the dual-needle technique (top left); image of the galvanized container, employed to hold the tissue specimen and placed in the thermal bath, and of the utilized sensors, i.e., dual-needle sensor connected to the thermal properties analyzer and fiber optic sensors, housed in a needle, for temperature monitoring (top right) [Citation62]. The heating needle of the instrument heats the tissue for th=30 s, and the monitoring needle measures the resulting tissue temperature for 90s. The initial temperature Tin is then subtracted to the readings to obtain the ΔT to be used in EquationEquations (4)(8)
(8) and Equation(5)
(10)
(10) (bottom left). Thus, the thermal diffusivity, volumetric heat capacity, thermal conductivity, and the estimated error (i.e., Syx) can be obtained for the specific tissue temperature (bottom right). (b) Illustration of the thermistor probe utilized for the measurement of thermal properties with the self-heated thermistor technique [Citation121]. Below, the graph taken from Bhavaraju and Valvano (Reprinted by permission from Springer Nature Customer Service Center GmbH: Springer, International Journal of Thermophysics, [Citation122], Copyright 2021) shows the trend of the applied thermistor power over the resulting temperature rise as a function of t−1/2. The linear regression is employed to calculate the steady-state and transient terms. Two materials of known thermal properties are employed (e.g., agar-gelled water and glycerol) for the thermistor probe calibration. (c) Differential scanning calorimetry (DSC) systems: power compensation DSC (top left) and heat-flux DSC (top right), ‘R’ and ‘S’ represent the reference pan and the sample pan, respectively (figure modified from [Citation123]). Below, example of DSC thermographs (heat flow versus temperature) attained with a differential scanning heat-flux calorimeter (bottom left) and resultant trend of specific heat capacity of biological tissues versus temperature (bottom right). Reprinted by permission from Springer Nature Customer Service Center GmbH: Springer Nature, Biophysics, [Citation124], Copyright 2021. Through the measurement of the heat flux with the empty crucible pan, the crucible with reference material (with known mass and specific heat), and the crucible with the tissue sample under analysis, it is possible to calculate the specific heat capacity of the tissue sample, knowing the sample mass. The trends marked with 1 and 2 refer to the measurement on the wall of Baker’s cyst tissue and adipose tissue surrounding the cyst; 1’ and 2’ refer to the same samples undergoing reheating.
![Figure 2. Techniques used for measuring thermal properties of biological tissues as temperature varies: setup and equipment. (a) Setup used to measure thermal properties with the dual-needle technique (top left); image of the galvanized container, employed to hold the tissue specimen and placed in the thermal bath, and of the utilized sensors, i.e., dual-needle sensor connected to the thermal properties analyzer and fiber optic sensors, housed in a needle, for temperature monitoring (top right) [Citation62]. The heating needle of the instrument heats the tissue for th=30 s, and the monitoring needle measures the resulting tissue temperature for 90s. The initial temperature Tin is then subtracted to the readings to obtain the ΔT to be used in EquationEquations (4)(8) α=[cPtransient/Pstaedy−state(1+dk)]2(8) and Equation(5)(10) σ(t)=σ0⋅ sin (ωt+δ)(10) (bottom left). Thus, the thermal diffusivity, volumetric heat capacity, thermal conductivity, and the estimated error (i.e., Syx) can be obtained for the specific tissue temperature (bottom right). (b) Illustration of the thermistor probe utilized for the measurement of thermal properties with the self-heated thermistor technique [Citation121]. Below, the graph taken from Bhavaraju and Valvano (Reprinted by permission from Springer Nature Customer Service Center GmbH: Springer, International Journal of Thermophysics, [Citation122], Copyright 2021) shows the trend of the applied thermistor power over the resulting temperature rise as a function of t−1/2. The linear regression is employed to calculate the steady-state and transient terms. Two materials of known thermal properties are employed (e.g., agar-gelled water and glycerol) for the thermistor probe calibration. (c) Differential scanning calorimetry (DSC) systems: power compensation DSC (top left) and heat-flux DSC (top right), ‘R’ and ‘S’ represent the reference pan and the sample pan, respectively (figure modified from [Citation123]). Below, example of DSC thermographs (heat flow versus temperature) attained with a differential scanning heat-flux calorimeter (bottom left) and resultant trend of specific heat capacity of biological tissues versus temperature (bottom right). Reprinted by permission from Springer Nature Customer Service Center GmbH: Springer Nature, Biophysics, [Citation124], Copyright 2021. Through the measurement of the heat flux with the empty crucible pan, the crucible with reference material (with known mass and specific heat), and the crucible with the tissue sample under analysis, it is possible to calculate the specific heat capacity of the tissue sample, knowing the sample mass. The trends marked with 1 and 2 refer to the measurement on the wall of Baker’s cyst tissue and adipose tissue surrounding the cyst; 1’ and 2’ refer to the same samples undergoing reheating.](/cms/asset/ea346af8-1456-476f-9246-6d3d63321084/ihyt_a_2028908_f0002_c.jpg)
Table 2. Overview of the material thermal properties and relevant information which can be obtained through the dual-needle technique, self-heated thermistor technique, and differential scanning calorimetry.
Figure 3. Principal measurement techniques employed for characterizing the mechanical behavior of biological tissues: setup and instrumentation. (a) System (Endura TEC ELF 3220) used for dynamical mechanical analysis tests on liver tissue (left); close-up on the acrylic platens, the tissue specimen, the loading cell, and the mover of the system used for the measurement of the viscoelastic properties (right). Reprinted from [Citation139], Copyright 2021, with permission from Elsevier. (b) Picture of the tissue specimen prepared for shear rheology tests, positioned between the upper and the lower plate of the parallel-plate system (a), sketch of the parallel-plate rheometer and the tissue (b): ‘H’ and ‘R’ represent the tissue specimen height and the plate radius, respectively. Reprinted from [Citation140], Copyright 2021, with permission from IOS Press. (c) Setup employed to perform share wave elastography measurements on ex vivo porcine brain tissues. Reprinted from [Citation141], Copyright 2021, with permission from Elsevier.
![Figure 3. Principal measurement techniques employed for characterizing the mechanical behavior of biological tissues: setup and instrumentation. (a) System (Endura TEC ELF 3220) used for dynamical mechanical analysis tests on liver tissue (left); close-up on the acrylic platens, the tissue specimen, the loading cell, and the mover of the system used for the measurement of the viscoelastic properties (right). Reprinted from [Citation139], Copyright 2021, with permission from Elsevier. (b) Picture of the tissue specimen prepared for shear rheology tests, positioned between the upper and the lower plate of the parallel-plate system (a), sketch of the parallel-plate rheometer and the tissue (b): ‘H’ and ‘R’ represent the tissue specimen height and the plate radius, respectively. Reprinted from [Citation140], Copyright 2021, with permission from IOS Press. (c) Setup employed to perform share wave elastography measurements on ex vivo porcine brain tissues. Reprinted from [Citation141], Copyright 2021, with permission from Elsevier.](/cms/asset/e0e7375d-f74b-4bc2-8a47-c7a8925e8e60/ihyt_a_2028908_f0003_c.jpg)
Table 3. Overview of the principal material parameters which can be obtained through classic stress-strain tests, dynamic oscillatory tests, and shear wave elastography.
Table 4. Thermophysical properties of biological tissues as a function of temperature.
Figure 4. (a) Thermal conductivity of different tissues and biological media (i.e., trabecular bone, brain, lung, pancreas, spleen, collagen, liver, myocardium, septal cartilage, kidney) as a function of temperature. (b) Temperature dependence of thermal conductivity of liver investigated in different studies including measurements in human, bovine, ovine, porcine, and rabbit tissues.
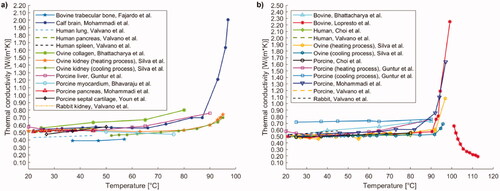
Figure 5. (a) Specific heat relative to hepatic, adipose tissue, brain (white and gray matter), compact bone tissue in axial, radial, and tangential direction, as a function of temperature. (b) Temperature-dependent specific heat of tumorous tissues such as glioblastoma, diffuse astrocytoma, breast cancer, and lung adenocarcinoma. The results were attained from the study by Sano et al. [Citation161].
![Figure 5. (a) Specific heat relative to hepatic, adipose tissue, brain (white and gray matter), compact bone tissue in axial, radial, and tangential direction, as a function of temperature. (b) Temperature-dependent specific heat of tumorous tissues such as glioblastoma, diffuse astrocytoma, breast cancer, and lung adenocarcinoma. The results were attained from the study by Sano et al. [Citation161].](/cms/asset/ceef7f4f-b2e3-42e9-82bf-95a30e7db048/ihyt_a_2028908_f0005_c.jpg)
Figure 6. Temperature dependence of volumetric heat capacity of different biological media, i.e., bovine liver, calf brain, ovine kidney, ovine liver, porcine liver, and porcine pancreatic tissue.
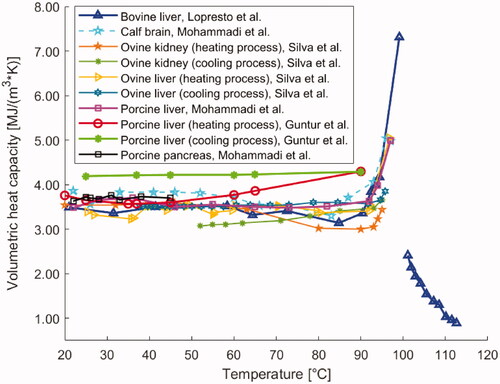
Figure 7. Thermal diffusivity of different biological materials (i.e., liver, brain, lung, pancreas, spleen, myocardium, and kidney tissue) versus temperature.
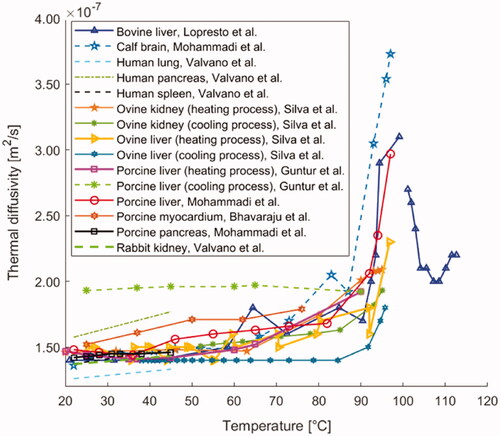
Table 5. Mechanical properties of biological tissues as a function of temperature.
Figure 8. Shear modulus of brain, liver, and muscle tissues as a function of temperature.
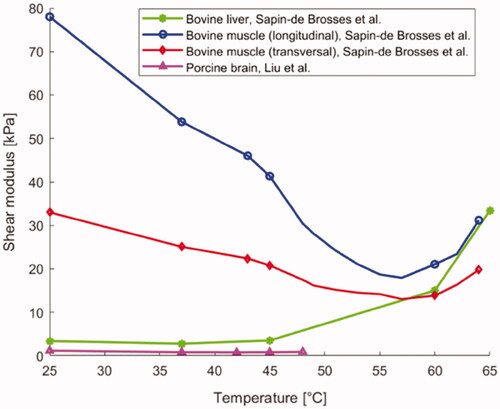
Figure 9. (a) Temperature dependence of storage modulus E' of porcine septal cartilage and back skin. (b) Trend of shear storage modulus G' of porcine liver specimens as a function of preparation temperature.
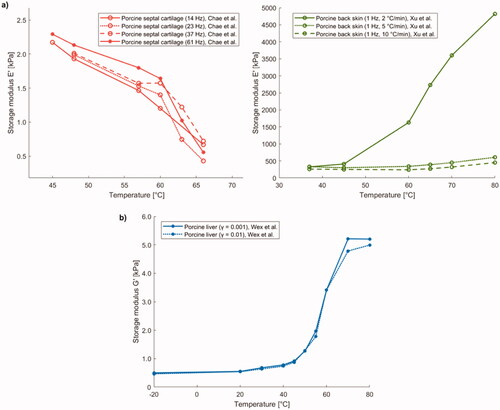
Figure 10. (a) Loss modulus E'' of porcine back skin versus temperature. (b) Trend of shear loss modulus G'' of porcine liver samples as a function of preparation temperature.
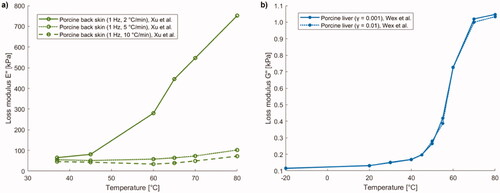
Figure 11. (a) Magnitude of complex modulus (|E*|) of canine and porcine liver samples prepared with radiofrequency ablation (RFA) or double immersion boiling (DIB) as a function of preparation temperature. (b) Magnitude of complex shear modulus (|G*|) of porcine liver versus preparation temperature.
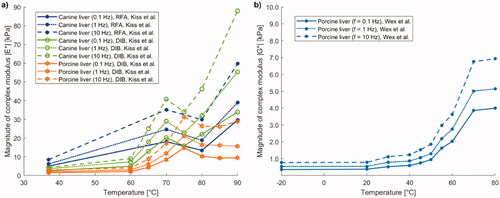
Figure 12. (a) Loss factor (tanδ = E''/E') of porcine back skin versus temperature, and tanδ of porcine and canine liver samples prepared with radiofrequency ablation (RFA) or double immersion boiling (DIB) as a function of preparation temperature. (b) Loss factor (tanδ = G''/G') of porcine liver versus preparation temperature.
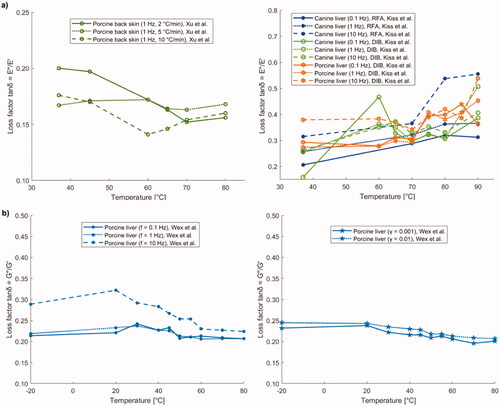
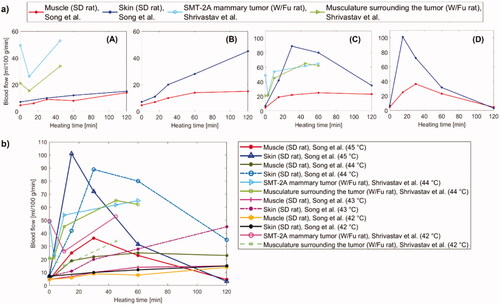
Figure 13. (a) Trend of blood flow versus heating time for different tissues, i.e., muscle, skin, and tumor at diverse hyperthermic temperatures: (A) 42 °C, (B) 43 °C, (C) 44 °C, (D) 45 °C. (b) Graphical representation combining the blood flow of muscle, skin, and tumor tissues as a function of heating time for all the above-mentioned temperatures, in the 42 °C–45 °C range.