Figures & data
Figure 1. Schematic representation of the workflow of Adapt2Heat, using Plan2Heat for pretreatment planning and preparation. In the pretreatment planning phase a CT scan of the patient is segmented and E-fields are calculated using Plan2Heat. In the preparation and conversion phase, the matrix elements are pre-computed (Equations (1,2)), and the coordinates of the thermometry sensors are specified, as well as the potential hot spot locations. Required volume and geometrical input files for Adapt2Heat are converted to VTK and GOF, respectively and Adapt2Heat uses an XML configuration file, specifying the planning input data and basic patient information, as name, date of birth, etc.
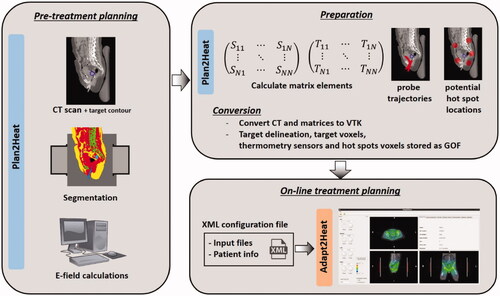
Figure 2. Situation during a hyperthermia treatment, where Adapt2Heat is used as an assistance tool. There is no direct connection between Adapt2Heat and the treatment control software, which avoids any risk of inadvertently affecting the actual treatment when using the treatment planning. The operators remain responsible for changing the system settings via the treatment control software.
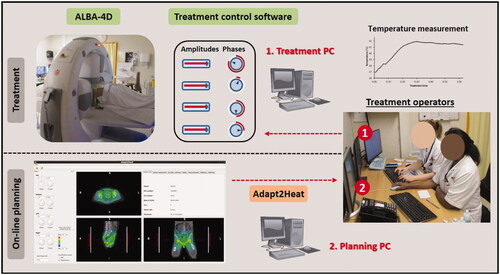
Figure 3. Screenshot of the graphical user interface of Adapt2Heat. A control panel (I) allows for phase-amplitude selection, power adjustment, scaling, switch between SAR and temperature visualization and initial phase optimization (A-E). Predicted distributions are instantly updated and projected onto the CT scan in the visualization windows (II). The selected orthogonal slices are indicated by dotted lines in each cross section (F). In the tabbed window (III), specific functionality can be selected by clicking the individual tabs, as explained in the text.
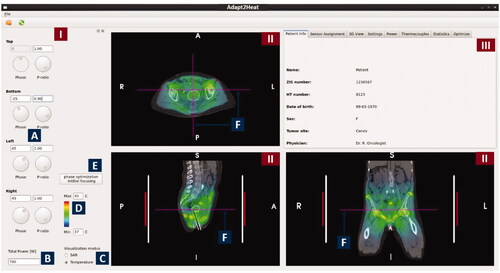
Figure 4. Tabs in the tabbed window of Adapt2Heat with specific functionality: Sensor assignment, 3 D view, Settings, Power, Thermocouples, Statistics and Optimize. The window in the right bottom corner also visualizes temperature display and distance measurement.
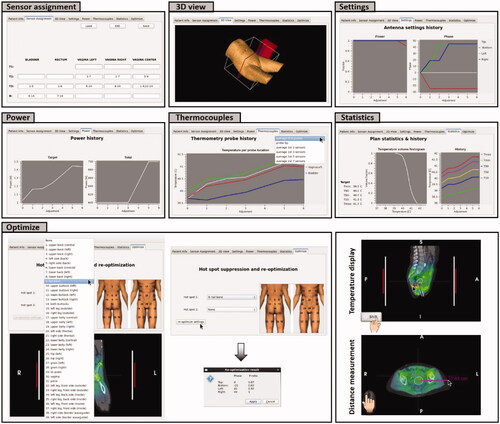
Figure 5. (A) Initial situation with a hot spot complaint at the pubic bone. (B) Predicted effect of the clinical steering strategy, reducing the power ratio for the top waveguide. (C) Evaluation of the effect of automatic re-optimization. Re-optimization is temperature based, reducing the temperature at the indicated hot spot location, while still maximizing target T90 and avoiding a significant temperature increase at all other potential hot spot locations.
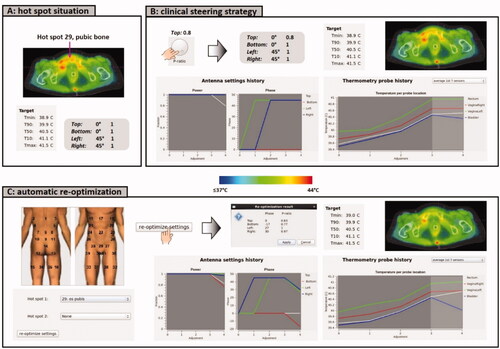
Figure 6. (A) Initial situation with equal amplitudes and phases. (B) Predicted temperature distribution after applying a numerical phase sweep for phase optimization to focus to the pancreatic tumor location. (C) Evaluation of the predicted effect of a clinical steering strategy and an alternative strategy to resolve a hot spot complaint in the lower belly.
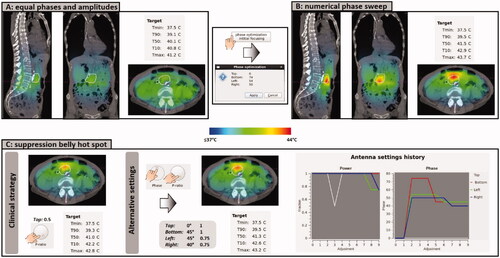
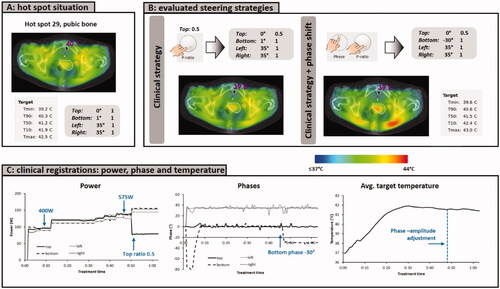
Figure 7. (A) Initial situation with a hot spot complaint at the pubic bone. (B) Predicted effect of the clinical steering strategy, reducing the power ratio for the top waveguide, as well as an additional phase shift for the bottom applicator. (C) Clinically recorded antenna settings and average target temperatures. After phase-amplitude adjustment, average target temperatures remained constant at ∼41.5 °C and the patient confirmed disappearance of the hot spot. The treatment was completed with these settings, without further incidence of hot spots.