Figures & data
Figure 1. Mitochondrial dysregulation and UCP2 expression in HUVECs during the recovery period following HS. HUVECs were subjected to two hours of HS, and further incubation at 37 °C for zero, six, and twelve hours. (a) Mitochondrial membrane potential (ΔΨm) was detected by JC-1 staining in HUVECs induced by HS, Scale bar: 20 μm. Cells (in green) represent JC-1 monomers and (in red) JC-1 aggregates. (b) Effect of HS on protein expression of p-Drp1S616, Drp1, Fis1, OPA1, and Mfn2 in HUVECs induced by HS. VDAC1 was used as loading control. (c,d) Quantification of p-Drp1S616, Drp1, Fis1, OPA1, and Mfn2 expressions. (e) Effect of HS on protein expression of UCP2 in HUVECs induced by HS. n = 4, *p < 0.05 versus the Cont. group.
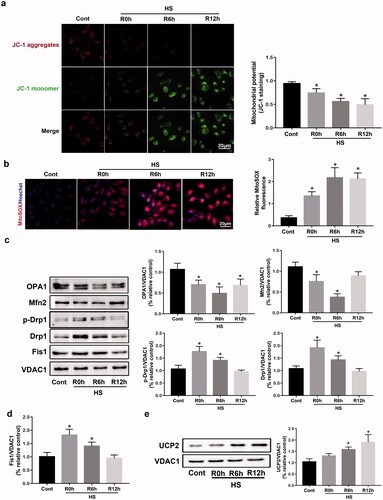
Figure 2. UCP2 deletion exacerbates cell death and mitochondrial dysregulation induced by HS. HUVECs were transfected with either control siRNA or UCP2 siRNA. Transfected HUVECs were subjected to two hours of HS, and further incubation at 37 °C for six hours. (a) Western blot and densitometric analyses of UCP2 protein expression. GAPDH was used as loading control. (b) The early apoptosis of HUVECs induced by HS was detected by Annexin V-FITC/PI staining. (c) Quantification of cell apoptosis in all groups. (d) The ΔΨm was detected by JC-1 staining in HUVECs induced by HS, Scale bar: 20 μm. n = 5, *p < 0.05 compared with the indicated groups.
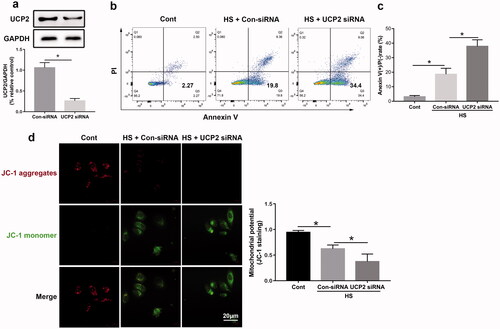
Figure 3. UCP2 regulates mitochondrial fission in HUVECs induced by HS. HUVECs were transfected with either control siRNA or UCP2 siRNA. Transfected HUVECs were subjected to two hours of HS, and further incubation at 37 °C for six hours. (a) Western blot analysis for p-Drp1S616, Drp1, Fis1, OPA1, Mfn2, and UCP2 in mitochondria isolated from HUVECs induced by HS, and standardized to VDAC1. (b) Representative images showing mitochondrial morphology with MitoTracker Red (red), Drp1 (green), and DAPI (blue) staining in HUVECs induced by HS. The Pearson's coefficient indexes between Drp1 and MitoTracker Red fluorescence intensities were measured in 10 or more cells from three independent experiments. Scale bar: 10 μm. n = 4, *p < 0.05 compared with the indicated groups. NS = not significant.
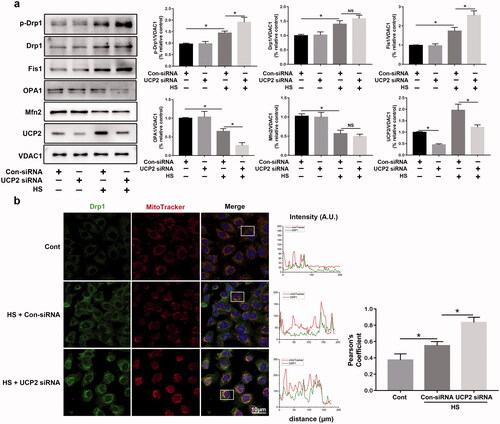
Figure 4. Drp1 inhibition enhances HS-induced mitochondrial fission in HUVECs induced by HS. HUVECs were pretreated with Mdivi-1 (10 μM) for two hours and then subjected to two hours of HS, and further incubation at 37 °C for six hours. (a) The early apoptosis of HUVECs induced by HS was detected by Annexin V-FITC/PI staining. (b) Cell viability of HUVECs was determined using Cell Counting Kit-8 (CCK8) assays. (c) Representative images showing mitochondrial morphology with MitoTracker Red (red) staining in HUVECs induced by HS, Scale bar: 10 μm. (d) Representative images and quantification of ΔΨm were detected by JC-1 staining in HUVECs induced by HS, Scale bar: 20 μm. (e) Western blot analysis for p-Drp1S616 and Drp1 in mitochondria isolated from HUVECs induced by HS, and standardized to VDAC1. n = 4, *p < 0.05 compared with the indicated groups.
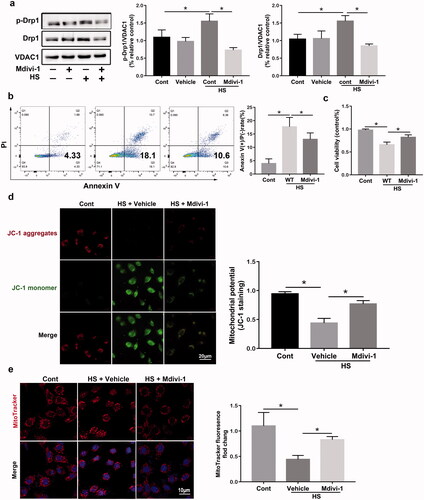
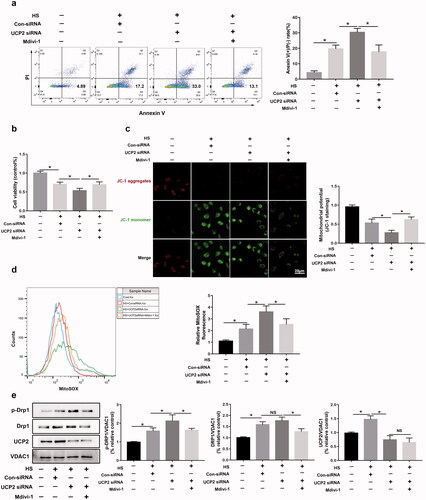
Figure 5. UCP2 regulates mitochondrial fission and apoptosis via Drp1 in HUVECs induced by HS. HUVECs were transfected with either Con-siRNA or UCP2 siRNA. Transfected HUVECs were pretreated with Mdivi-1 (10 μM) for 2 h, and then subjected to two hours of HS, and further incubation at 37 °C for six hours. (a) The early apoptosis of HUVECs induced by HS was detected by Annexin V-FITC/PI staining. (b) The CCK8 assay assessed cell viability. (c) Mitochondrial membrane potential (ΔΨm) was detected by JC-1 staining in HUVECs induced by HS, Scale bar: 20 μm. (d) Representative images and quantification of mitochondrial O2. The formation was assessed by MitoSOX using flow cytometry. (e) Western blot analysis for p-Drp1S616, Drp1, and UCP2 in mitochondria isolated from HUVECs induced by HS, and standardized to VDAC1. n = 4, *p < 0.05 compared with the indicated groups. NS = not significant.