
Figures & data
Table 1. Baseline characteristics in the unmatched cohort and the matched cohort, n (%).
Figure 1. Kaplan–Meier curves of stage-IV NSCLC. (A) thermal ablation plus chemotherapy versus chemotherapy for OS before PSM; (B) thermal ablation plus chemotherapy versus chemotherapy for LCSS before PSM; (C) thermal ablation plus chemotherapy versus chemotherapy for OS after PSM; (D) thermal ablation plus chemotherapy versus chemotherapy for LCSS after PSM. NSCLC: nonsmall cell lung cancer; OS: overall survival; LCSS: lung cancer-specific survival; PSM: propensity score matching.
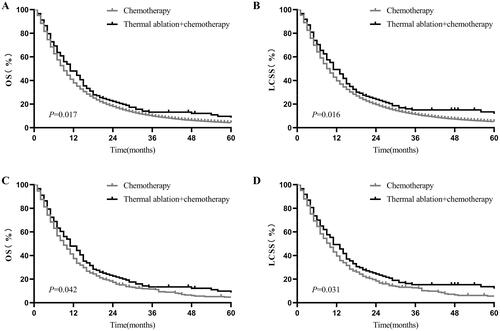
Figure 2. Kaplan–Meier curves of stage-IV NSCLC. A: thermal ablation plus chemotherapy versus chemotherapy for OS of patients aged <70 years before PSM; B: thermal ablation plus chemotherapy versus chemotherapy for LCSS of patients aged <70 years before PSM; C: thermal ablation plus chemotherapy versus chemotherapy for OS of patients aged ?70 years after PSM; D: thermal ablation plus chemotherapy vs. chemotherapy for LCSS of patients aged ?70 years after PSM. NSCLC: nonsmall cell lung cancer, OS: overall survival, LCSS: lung cancer-specific survival, PSM: propensity score matching.
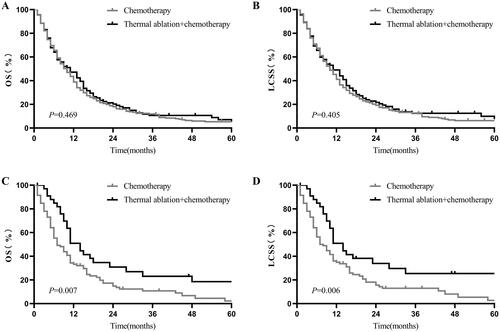
Figure 3. Kaplan–Meier curves of stage-IV NSCLC. (A) thermal ablation plus chemotherapy versus chemotherapy for OS of patients with tumor size 3 cm before PSM; (B) thermal ablation plus chemotherapy versus chemotherapy for LCSS of patients with tumor size 3 cm before PSM; (C) thermal ablation plus chemotherapy versus chemotherapy for OS of patients with tumor sizes of 3.1–5.0 cm after PSM; (D) thermal ablation plus chemotherapy versus chemotherapy for LCSS of patients with tumor sizes of 3.1–5.0 cm after PSM. NSCLC: nonsmall cell lung cancer; OS: overall survival; LCSS: lung cancer-specific survival; PSM: propensity score matching.
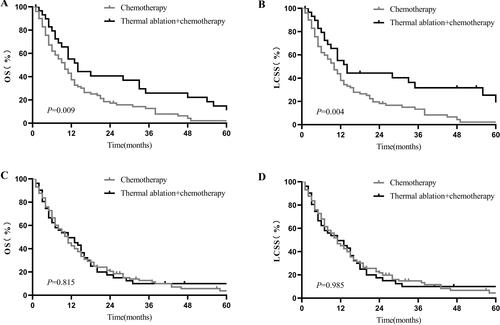
Figure 4. Kaplan–Meier curves of stage-IV NSCLC. (A) thermal ablation plus chemotherapy versus chemotherapy for OS of patients with tumor sizes of 5.1–7.0 cm before PSM; (B) thermal ablation plus chemotherapy versus chemotherapy for LCSS of patients with tumor sizes of 5.1–7.0 cm before PSM; (C) thermal ablation plus chemotherapy versus chemotherapy for OS of patients with tumor size >7.0 cm after PSM; (D) thermal ablation plus chemotherapy versus chemotherapy for LCSS of patients with tumor size >7.0 cm after PSM. NSCLC: nonsmall cell lung cancer; OS: overall survival; LCSS: lung cancer-specific survival; PSM: propensity score matching.
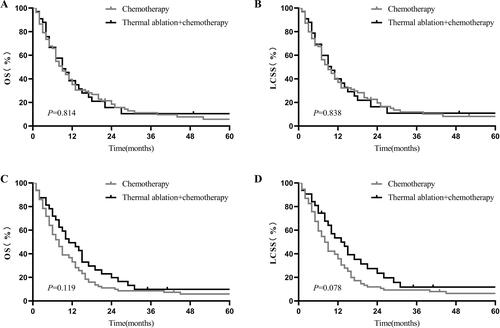
Table 2. Univariable and multivariable analysis for OS in the whole cohort.
Table 3. Univariable and multivariable analysis for LCSS in the whole cohort.
Supplemental Material
Download PDF (771.9 KB)Data availability statement
All the data that support the results of the current study are publicly available in the SEER database (https://seer.cancer.gov/).