
Figures & data
Figure 1. Knock down c-Myc inhibits NPC cells proliferation. (A,B) The knockdown efficiency of c-Myc confirmed using Western blot and qRT-PCR. (C) CCK-8 assay in CNE1 and CNE2 cells transfected with negative control (siNC) or c-Myc siRNA and cultured for the indicated times. (D,E) Colony formation assay showed reduced colony number of CNE1 and CNE2 cells after silence of c-Myc. F) Western blot analysis of the indicated proteins in CNE1 and CNE2 cells transfected with negative control (siNC) or c-Myc siRNA. GAPDH served as loading control. (G) mRNA levels expression of c-Myc, PCNA, CDK1 and CDK4 was evaluated by qRT-PCR. GAPDH served as reference gene. Data shown as mean ± sd.
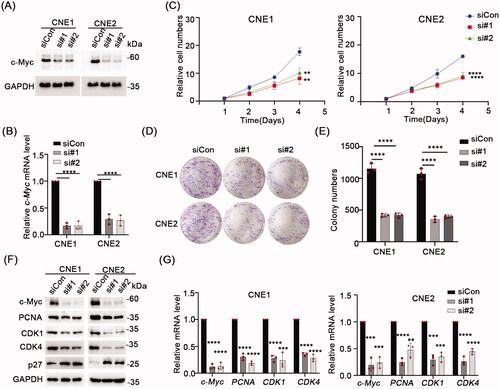
Figure 2. Overexpression c-Myc inhibits NPC cells proliferation. (A) Western blot analyses were used to analyze c-Myc protein expression in CNE1 and CNE2 cells stablely expressing c-Myc. (B) qRT-PCR was used to analyze c-Myc mRNA level in CNE1 and CNE2 cells stably expressing c-Myc. (C) CCK-8 assay indicated that c-Myc overexpression significantly increased cell proliferation ability in CNE1 and CNE2 cells. (D,E) c-Myc overexpression promoted colony formation ability in CNE1 and CNE2 cells stably expressing c-Myc. (F) Western blot analysis of the indicated proteins in CNE1 and CNE2 cells stably expressing c-Myc. GAPDH served as loading control. G, mRNA levels of c-Myc, PCNA, CDK1 and CDK4 was evaluated by qRT-PCR in CNE1 and CNE2 cells stably expressing c-Myc. Data shown as mean ± sd.
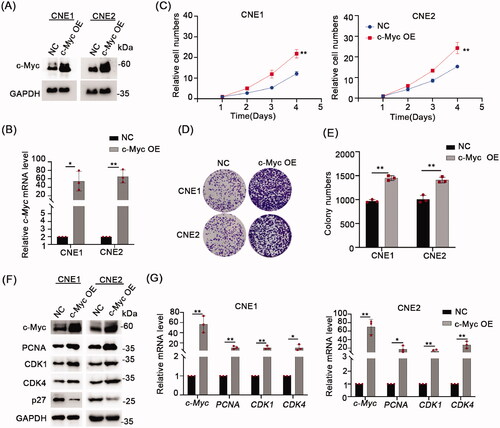
Figure 3. Hyperthermia can inhibit NPC cells growth and degrade c-Myc. (A) Effect of 43 °C heat treatment on cell proliferation of CNE1 and CNE2 cells was measured using CCK-8 assays. The cells were heat treated every two days. (B) Representative pictures of colony formation assays in CNE1 and CNE2 cells. The cells were heat treated every two days. (C) Colony number counts compared between the Control and Heat treatment groups (HT). (D) Protein levels of c-Myc, PCNA, CDK1, CDK4 and p27 were evaluated by Western blot after 43 °C heat treatment for 30 min and recovery for 24 h at 37 °C. (E) mRNA levels of c-Myc, PCNA, CDK1, and CDK4 evaluated by qRT-PCR as per D. Data shown as mean ± s.d.
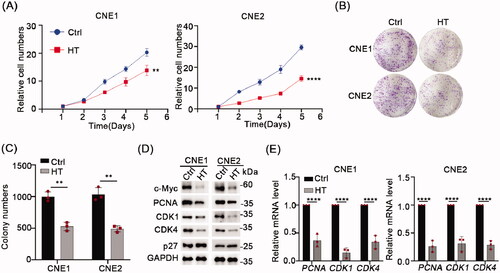
Figure 4. Hyperthermia blocks the cell cycle and induces apoptosis. (A,B) Apoptosis levels in CNE1 and CNE2 cells after 43 °C heat treatment for 30 min and recovery for 24h at 37 °C measured by flow cytometry using the Annexin V/PI dual-parameter method. (C) DNA content of CNE1 and CNE2 cells evaluated by flow cytometry using PI staining. Cells were heat-treated at 43 °C for 30 min and allowed to recover for 8 h at 37 °C before analysis. (D) Statistical data shows the different ratio of cell cycle phase in CNE1 and CNE2 cells. The data are displayed as mean ± s.d. **p < 0.01 ****p < 0.0001, compared with NC. NC: negative control; HT: hyperthermia.
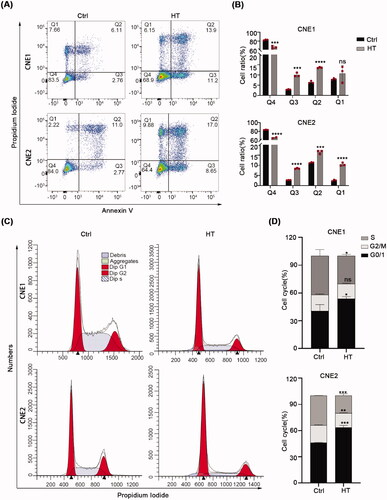
Figure 5. Hyperthermia induces c-Myc degradation through the proteasomal pathway. (A) CNE1 and CNE2 cells were subjected to 43 °C heat treatment for 15 min, 30 min or 60 min, and cell lysates immediately collected for Western blot detection of c-Myc levels. (B) CNE1 and CNE2 cells were subjected to 43 °C heat treatment for 30 min and cells immediately collected for qRT-PCR analysis to detect c-Myc mRNA levels. (C) c-Myc protein level recovery after hyperthermia. CNE1 and CNE2 cells were heat treated at 43 °C for 30 min and allowed to recover at 37 °C for the indicated times before Western blotting analysis. (D) c-Myc can be kept at a relatively low levels following daily hyperthermia. CNE1 and CNE2 cells were heat treated at 43 °C for 30 min every day and allowed to recover at 37 °C for the indicated times. (E) Hyperthermia-induced degradation of c-Myc can be rescued by MG132 but not CQ. CNE1 and CNE2 cells were treated with 10μM MG132 for 4h or 10μM CQ for 24h before heat treatment. Cells were collected immediately after heat treatment at 43 °C for 30 minutes. (F) Hyperthermia-induced degradation of exogenous c-Myc can be rescued by MG132. HEK293T cells were transfected with the pCDH-c-Myc vector before treatment with 10μM MG132 for 4h or 10μM CQ for 24h before heat treatment at 43 °C for 30 minutes. Cells were immediately collected for analysis by Western blot. (G) Hyperthermia increases the ubiquitination levels of c-Myc. Cells were collected immediately after heat treatment at 43 °C for 30 minutes. GAPDH served as loading control.
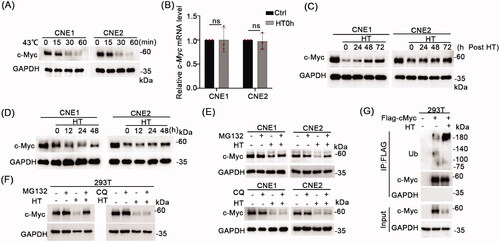
Figure 6. Hyperthermia suppresses NPC xenograft growth in nude mice. (A) Treatment schedule. Mice were injected subcutaneously with CNE2 cells and allowed to establish xenografts for two weeks before subjecting the treatment group mice to immersion in a 43 °C water bath for 30 min on days 14, 17, 20 and 23. (B) Whole body images of the mice on day 26 showing hyperthermia treatment resulted in smaller tumors than the control group. (C) Images of the excised tumors after sacrifice on day 26. (D) Final tumor weight comparisons. (E) Tumor growth size was monitored throughout the experiment. (F) Total body weight monitoring throughout the experiment. Data are presented as mean ± s.d.; n = 5 tumors for each group. ****p < 0.0001.
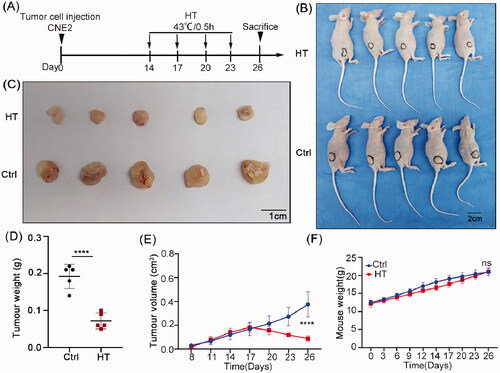
Figure 7. Hyperthermia inhibits NPC proliferation and promotes apoptosis in vivo. (A) Protein levels of c-Myc, PCNA, CDK1 and CDK4 in the xenografted CNE2 tumors subjected to control or hyperthermia treatments assayed using Western blot. (B) Representative immunohistochemical staining of c-Myc, Ki-67 and PCNA levels in CNE2 tumors. (B) Quantitative assessment of tumor cell positivity of the markers in C. (D) Representative images of TUNEL assays conducted on CNE2 tumor sections. Apoptotic cells are stained green with cell nuclei shown in blue. (E) Quantitative assessment of tumor cell positivity of TUNEL staining from D. Data are presented as mean ± s.d.; ***p < 0.001 and ****p < 0.0001.
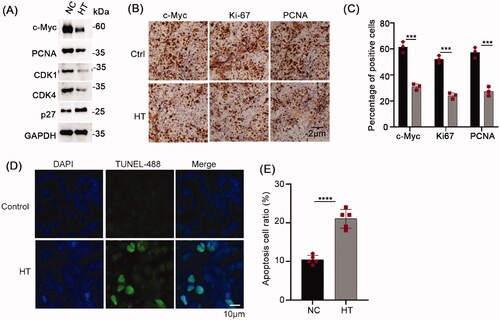
Figure 8. Hyperthermia-induced changes in the NPC cell transcriptome. (A) Volcano plot based on RNA sequencing of CNE2 cells comparing heat treatment versus control treatment samples. Upregulated DEGs (Log2 Fold Change ≥2, p value < 0.05) are colored red; Downregulated DEGs (Log2 Fold Change ≤−2, p value < 0.05) are colored blue. n = 3 biologically independent samples were analyzed for each condition. (B) PPI network analysis based on RNA sequencing analysis in A. Red nodes represent upregulated genes and blue nodes represent downregulated genes. |log2FC| ≥1.5 and p < 0.05 were set as cutoff criteria. (C) Interaction networks between c-Myc and target DEGs. Red nodes represent upregulated genes and blue nodes represent downregulated genes.
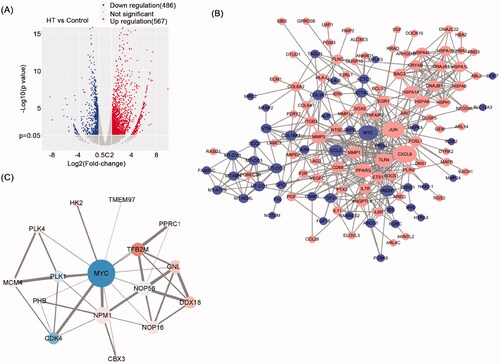
Table 1. Rank method in CytoHubba.