
Figures & data
Figure 1. (A) 42-year-old woman with papillary thyroid cancer with capsular invasion (CI) was treated with microwave ablation (MWA). (A) pre-MWA, ultrasound(US) showed a hypoechoic target tumor (arrows) with CI (triangles); (B) before MWA, contrast-enhanced US (CEUS) showed a hypo-enhancement pattern in the artery phase (arrows); (C) the hydrodissection technique (triangles) was used to protect the surrounding structures (arrows); (D) US showed a hyperechoic pattern in the tumor (arrows) during ablation; (E) post-MWA, CEUS showed no enhancement (arrows) in the tumor area; and (F) on one-month post-MWA, US showed a hypoechoic ablation zone (arrows).
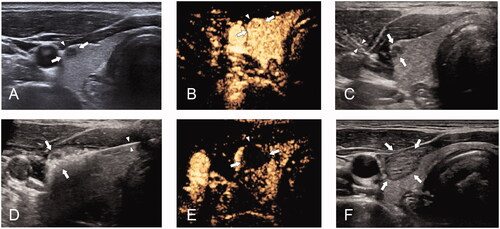
Figure 2. Flow chart of patient selection.
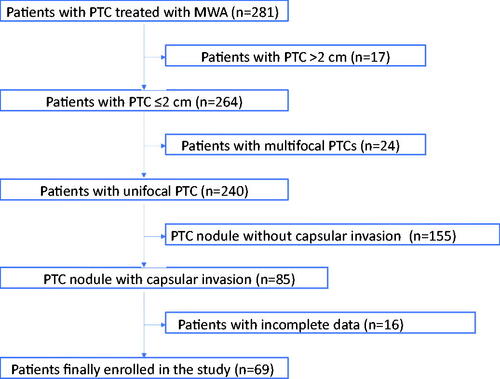
Figure 3. Changes in mean volume at each follow-up.
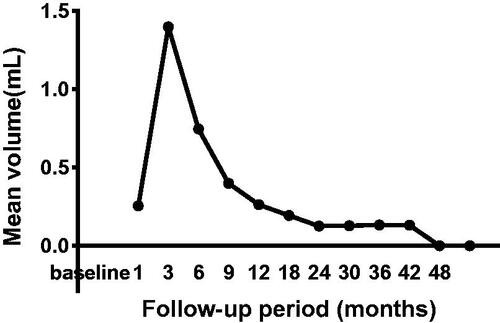
Table 1. Demographic characteristics of PTC with CI included in this study (n = 69).
Table 2. Tumor size (maximum diameter and volume) before MWA and at each follow-up time-point after MWA.
Figure 4. Changes in VRR at each follow-up.
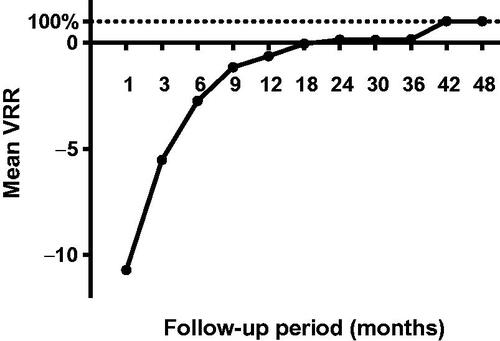
Table 3. Demographic characteristics of cases with or without tumor progression in the present study.
Data availability statement
The datasets used and/or analyzed during the current study are available from the corresponding author on reasonable request.