Figures & data
Figure 1. Flow diagram of the study selection procedure.
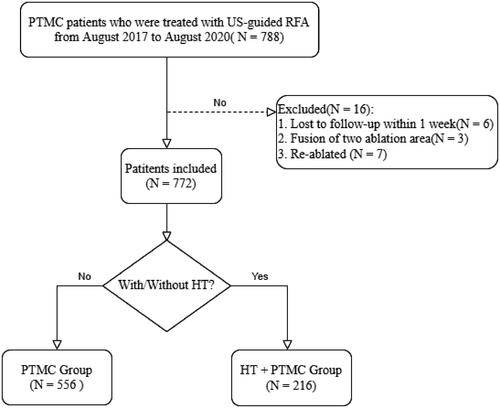
Table 1. The demographic and ablation data of the selected patients and lesions.
Figure 2. Changes in maximum diameters in PTMC cases with/without HT. Error bar: 95% confidence interval; PTMC: papillary thyroid microcarcinoma; HT: Hashimoto's thyroiditis.
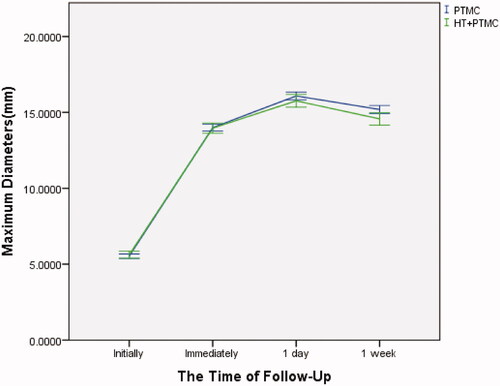
Table 2. The maximum diameters of the lesion before and after RFA (mm).
Figure 3. Changes in volumes in PTMC cases with/without HT. Error bar: 95% confidence interval; PTMC: papillary thyroid microcarcinoma; HT: Hashimoto's thyroiditis.
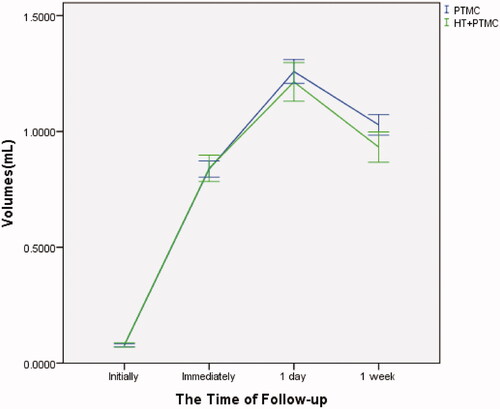
Table 3. The volumes of the lesion before and after RFA (mL).