Figures & data
Figure 1. Flowchart for the patient selection and study design.
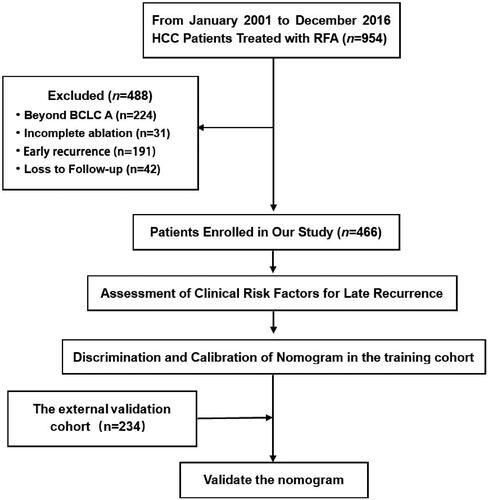
Table 1. Patient demographics of primary cohort.
Table 2. Cox regression analyses of clinical risk factors for late recurrence in the primary cohort.
Figure 2. Kaplan–Meier curve for the RFS (a) and OS (b) of patients between low-risk and high-risk groups. RFS, recurrence-free survival; OS, overall survival.
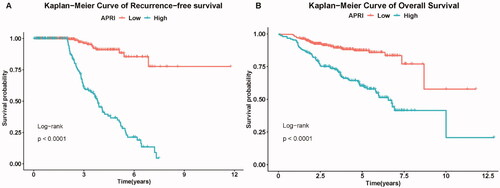
Figure 3. The nomogram for predicting the three-, four- and five-year RFS after RFA. RFS, recurrence-free survival; RFA, radiofrequency ablation.
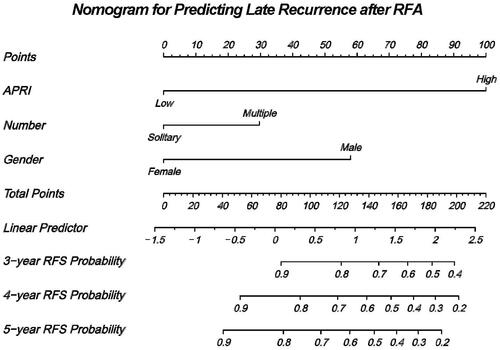
Figure 4. The t-ROC of the nomogram for predicting the three-year (a), four-year (b) and five-year (c) RFS in patients with HCC after RFA. t-ROC, time-dependent receiver operating characteristic curve; RFS, recurrence-free survival; HCC, hepatocellular carcinoma; RFA, radiofrequency ablation.
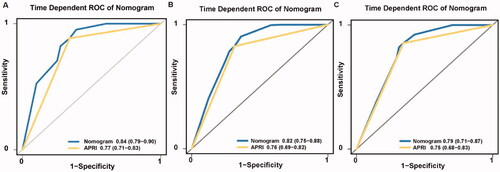
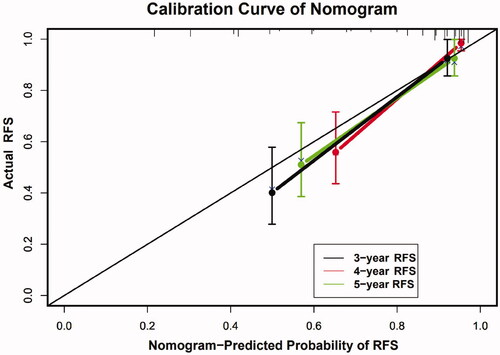
Figure 5. The calibration curves for predicting the three-, four- and five-year RFS in patients with HCC after RFA. RFS, recurrence-free survival; HCC, hepatocellular carcinoma; RFA, radiofrequency ablation.
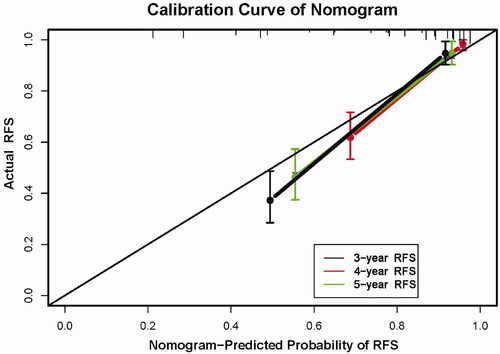
Figure 6. Kaplan–Meier curve for the RFS (a) and OS (b) of patients between low-risk and high-risk groups in the external validation cohort. RFS, recurrence-free survival; OS, overall survival.
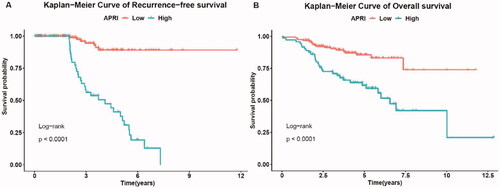
Figure 7. The t-ROC of the nomogram for predicting the three-year (a), four-year (b) and five-year (c) RFS in the external validation cohort. t-ROC, time-dependent receiver operating characteristic curve; RFS, recurrence-free survival.
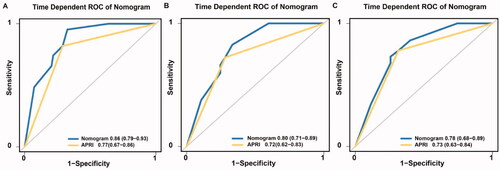
Figure 8. The calibration curves for predicting the three-, four- and five-year RFS in the external validation cohort. RFS, recurrence-free survival.