
Figures & data
Figure 1. Flow chart of different HIFU sonication strategies of CSP patients treated with USgHIFU and USg-D&C.
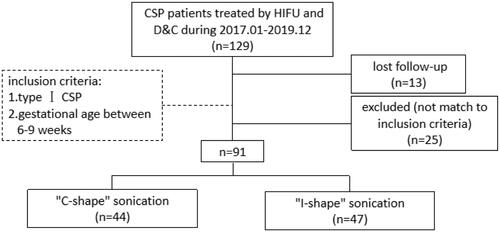
Figure 2. Sonication points distribution. (a) Sonication points (green dots) around the embedding area of the gestational sac were just like the ‘C’ glyph; (b) Sonication points (green dots) in a line in the base of the embedding area of the gestational sac were like the ‘I’ glyph.
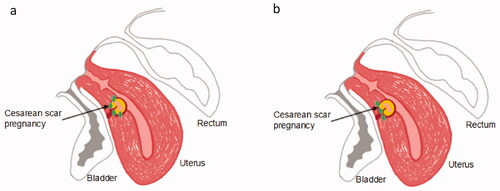
Table 1. Comparison of baseline characteristics of CSP patients treated with HIFU in different strategies.
Table 2. Comparison of HIFU treatment results for CSP patients treated with HIFU in different strategies.
Table 3. Comparison of adverse events during HIFU treatment between the patients treated with different strategies.
Table 4. Comparison of USg-D&C treatment results for CSP patients treated with HIFU in different strategies.