Figures & data
Figure 1. Schematic of the Phantom fabrication.
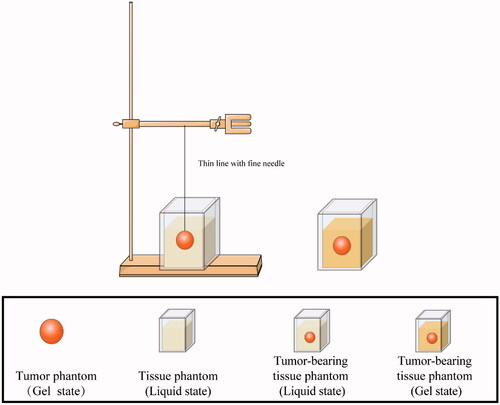
Figure 2. Schematic of the US-guided microwave ablation (MWA, a form of thermal ablation). The ablation needle was advanced into the tumor under US guidance, and the microwave therapy instrument started with fixed parameters: 50 W and 8 min.
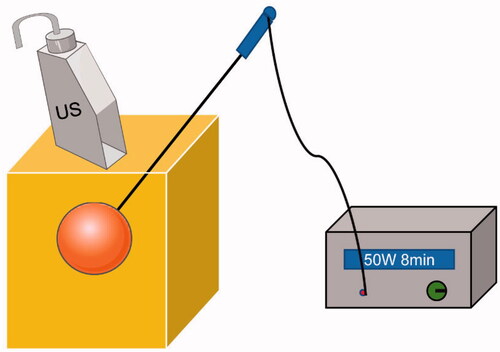
Figure 3. The gross specimen (about 3 cm diameter) and ultrasound image of the normal tissue phantom sample.
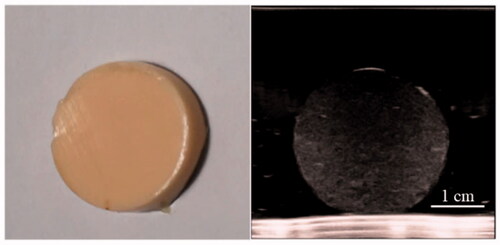
Figure 4. US and CT images of the disc-shaped phantom samples (with about 3 cm diameter) that were sliced from the spherical tumor phantom. (A) The ultrasound images (Philip EPIQ7, 7.5 MHz linear array probe) are depicted for four different psyllium husk concentration. (B) The CT number of tumor phantom sample was compared with that of normal tissue phantom sample (SAMATOM Force, 40 mA 120 kV).
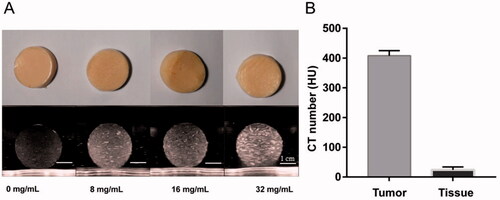
Figure 5. US imaging of the phantom model: A: Gross specimen of the phantom model. B, C: the US images illustrate the tumor embedded in normal tissue phantom (B: 3.5-5.0 MHz convex array probe, C: 7.5 MHz linear array probe). D: the US image of puncture needle that was advanced into the tumor.
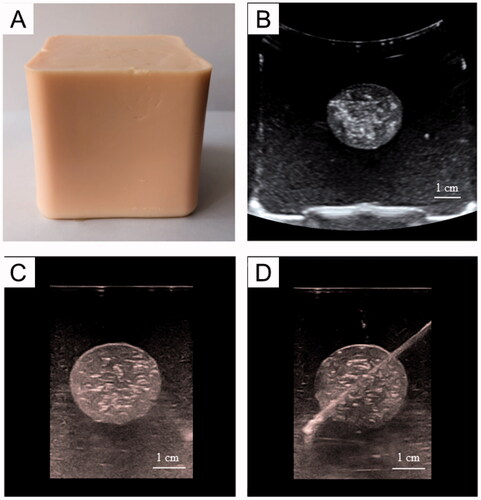
Figure 6. 3 D-CT imaging of the tumor-bearing tissue phantom (SAMATOM Force, 40 mA 120 kV). A: 3 D-CT imaging of the phantom model: B: the 3 D-CT image illustrates the tumor embedded in normal tissue phantom. C, D: the 3 D-CT images of puncture needle that was advanced into the tumor.
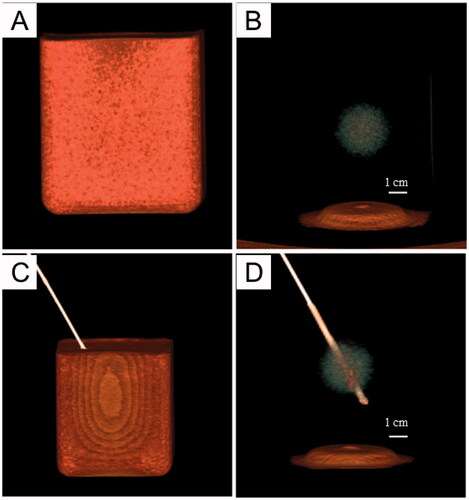
Figure 7. MR imaging of the tumor-bearing tissue phantom (3 T Philips Ingenia Elition X, T2-weighted MR imaging, TR: 842.7 TE:80.0, slice thickness 6 mm, field of view (FOV) = 250 × 250 mm2, matrix = 320 × 320). The T2 signal intensity in the tumor region is lower than that in the tissue region.
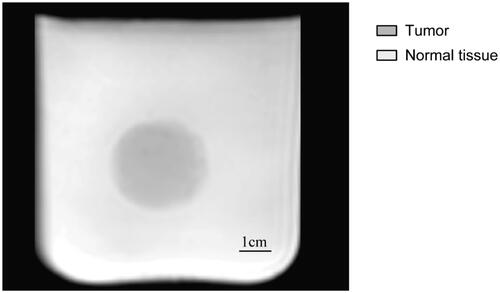
Figure 8. Bottom: unheated phantom samples. Top: phantom samples heated to 60 °C. Left: disc-shaped samples sliced from normal tissue phantom. Right: disc-shaped samples sliced from tumor phantom. Bar = 1 cm.
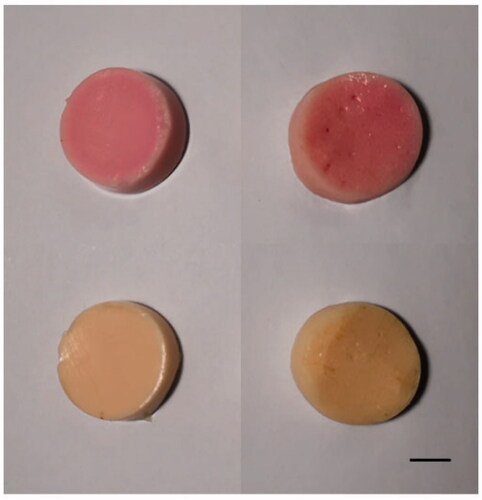
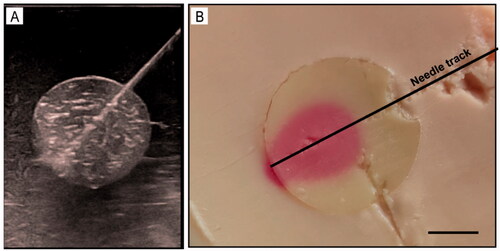
Figure 9. (A) US-guided tumor puncture. (B) The gross specimen of the phantom model after MWA. Bar = 1 cm.