
Figures & data
Figure 1. The flowchart shows the study protocol. 2DUS: two-dimensional ultrasound; 3DUS-FI: three-dimensional ultrasound fusion imaging.
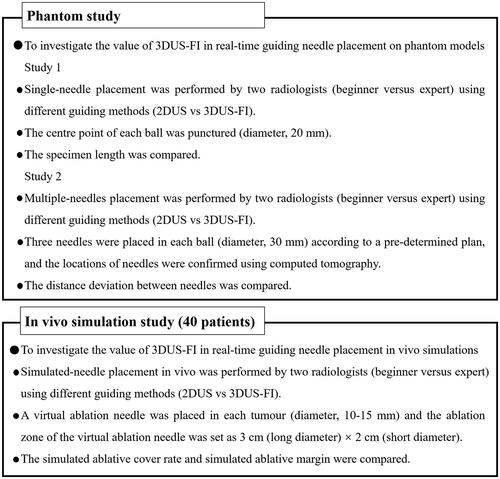
Figure 2. These photographs show the phantom models used to perform needle placement. (a) A phantom model consisted of colloid (colorless) and balls mimicking liver tumors (red). (b) A ball (20 mm in diameter) was used to perform a single-needle placement, and a ball (30 mm in diameter) was used to perform multiple-needles placement. Wrap the ball with film to prevent lopromide infiltration that may cause poor computed tomography (CT) scan. (c) The red stripe (arrow) inside the biopsy needle groove was a specimen after puncturing the center point of the ball. (d) A CT image after multiple-needles placement. The round, high echo was the largest coronal plane of the ball (30 mm in diameter) and the strong echo (arrows) were the points where the three needles passed through the largest coronal plane of the ball.
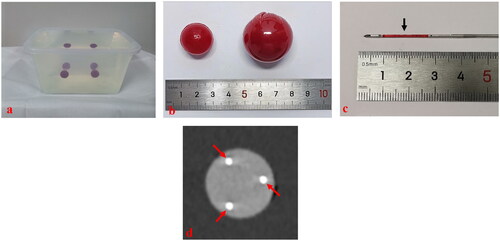
Figure 3. These photographs show needle placement on phantom models guided by three-dimensional ultrasound fusion image (3DUS-FI). Real-time two-dimensional ultrasound (2DUS) images (upper left), three-dimensional ultrasound (3DUS) volume images (lower left), 3 D views of the coronal plane (upper right) and lateral (lower right) of the ball were simultaneously displayed on a screen. The green balls and bright dots (white arrows) in 3 D views were 3 D displays of the ball and its center point based on magnetic position tracking. (a) With the probe’s movement, the 3 D positional relationship between real-time 2DUS images and the ball could be directly observed in 3 D views (yellow arrows). The largest plane and the center point of the ball (red arrow) could be observed in real-time to guide needle placement by moving the probe to make real-time 2DUS images toward the center points (white arrows) in 3 D views. (b) The virtual ablation needle and the probe were linked by magnetic position tracking. With the probe’s (yellow arrow) movement, the 3 D positional relationship between virtual ablation needles (red arrows) and the ball could be observed in 3 D views. Needle positions that had been placed inside the ball (blue arrows) could real-time be saved in 3 D views (red arrows), which provided important information for multiple-needles placement.
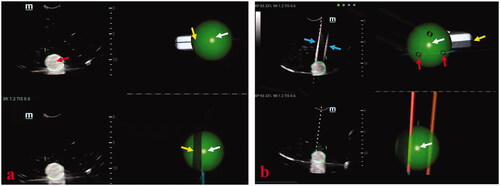
Figure 4. Photographs show assessments of needle placement performed on phantom models. (a) The specimen length (black arrows) of puncturing the center point (white arrow) of a ball (20 mm in diameter) was used to assess the accuracy of the single-needle placement. The longer the length of the specimen, the puncturing point was closer to the center point of the ball and the accuracy of single-needle placement higher. (b) When three needles were placed in a ball (30 mm in diameter), a triangle was formed from the three points where the three needles passed through the largest coronal plane of the ball. (c) The three side lengths of the triangle were actual distances between needles and marked with a, b, and c. Successful multiple-needles placement was defined as the center point of the largest coronal plane inside the triangle. (d) The pre-determined plan of multiple-needles placement was placing three needles in a ball (30 mm in diameter) and the three points where the three needles passed through the largest coronal plane of the ball forming an ideal equilateral triangle with the side length of cm. Therefore, the ideal distance between needles was
cm. Distance deviation between needles was a quantitative term to assess the deviation degree of the actual distance between needles and the ideal distance between needles and was used to assess the accuracy of multiple-needles placement. Thus, considering this variance for reference, distance deviation between needles was calculated as [(a-
)2+(b-
)2+(c-
)2]/3. The smaller the distance deviation between needles, the closer the multiple-needles placement was to the pre-determined plan and the higher the accuracy of multiple-needles placement.
![Figure 4. Photographs show assessments of needle placement performed on phantom models. (a) The specimen length (black arrows) of puncturing the center point (white arrow) of a ball (20 mm in diameter) was used to assess the accuracy of the single-needle placement. The longer the length of the specimen, the puncturing point was closer to the center point of the ball and the accuracy of single-needle placement higher. (b) When three needles were placed in a ball (30 mm in diameter), a triangle was formed from the three points where the three needles passed through the largest coronal plane of the ball. (c) The three side lengths of the triangle were actual distances between needles and marked with a, b, and c. Successful multiple-needles placement was defined as the center point of the largest coronal plane inside the triangle. (d) The pre-determined plan of multiple-needles placement was placing three needles in a ball (30 mm in diameter) and the three points where the three needles passed through the largest coronal plane of the ball forming an ideal equilateral triangle with the side length of 3 cm. Therefore, the ideal distance between needles was 3 cm. Distance deviation between needles was a quantitative term to assess the deviation degree of the actual distance between needles and the ideal distance between needles and was used to assess the accuracy of multiple-needles placement. Thus, considering this variance for reference, distance deviation between needles was calculated as [(a-3)2+(b-3)2+(c-3)2]/3. The smaller the distance deviation between needles, the closer the multiple-needles placement was to the pre-determined plan and the higher the accuracy of multiple-needles placement.](/cms/asset/8f7a9535-f24b-46fe-8a69-e8d885baeb75/ihyt_a_2057596_f0004_c.jpg)
Figure 5. These photographs show simulated-needle placement performed in a liver tumor with the largest diameter of 10 mm by three-dimensional ultrasound fusion image (3DUS-FI). (a) The safety margin of the tumor of 5 mm was outlined for 3 D tracing by two concentric spheres in different colors (the radius difference was 5 mm). Real-time two-dimensional ultrasound (2DUS) images (left) and three-dimensional ultrasound (3DUS) volume images (right) were registered efficiently. (b) Real-time 2DUS images (upper left), 3DUS volume images (lower left), three-dimensional (3 D) views of the coronal plane (upper right) and lateral (lower right) of the tumor were simultaneously displayed on a screen. When the patient held the breath at the end of inspiration (with the same respiratory phase while acquiring 3DUS volume images of the tumor), the largest plane and the real-time center point of the tumor could be observed to guide needle placement. The virtual ablation needle was placed at the center of the tumor to achieve complete overlapping between the ablation zone and the tumor with a 5-mm safety margin. When the virtual ablation needle was placed, the simulated ablative cover rate was automatically displayed on the screen in real-time (red arrow).
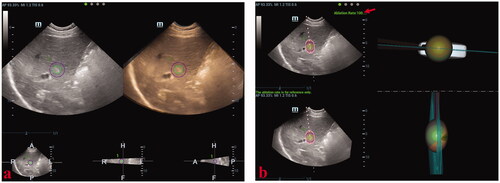
Table 1. Results of single-needle placement performed on phantom models.
Table 2. Results of multiple-needles placement performed on phantom models.
Table 3. Results of simulated-needle placement performed in patients (n = 40).