Figures & data
Figure 1. Computational model used in the study: (a) 2D axisymmetric model of a spherical metal implant and surrounding tissue used in this study (R1 = 4 cm, R2 = 12 cm). (b) The spatial temperature distribution through a cross-section of the implant after 10s of uniform skin-effect (0.9681 mm at 200 kHz) heating shows the conduction of heat inward into the metal implant and outward into tissue. The reduction of bacteria on the surface, and the tissue thermal dose at 1, 2 and 3 mm were quantified for different exposure conditions.
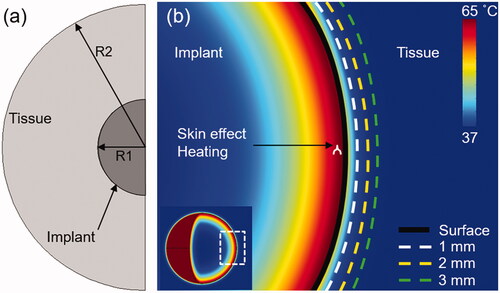
Table 1. Physical properties of materials used in simulations.
Table 2. Arrhenius coefficients of different bacterial strains.
Figure 2. Reduction of biofilm with heat: log 10 (CFU) reduction of biofilm as a function of time for different incubation temperatures. (a) S. aureus (TIDB1675) strain (b) P. aeruginosa (PA01) strain (c) Arrhenius fitting of four different bacterial strains show consistency with gram positive and gram negative strains, but different rates of elimination across strains.
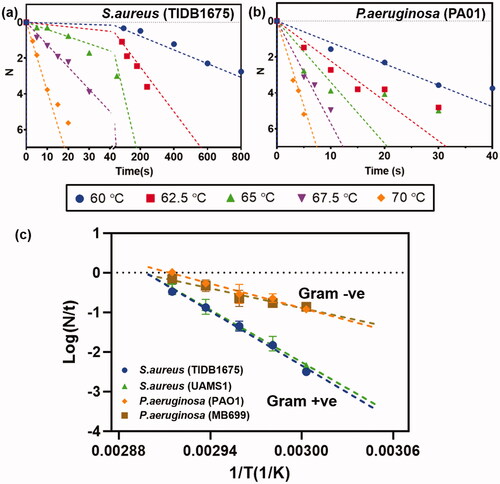
Figure 3. Effect of skin effect heating: Comparison between (a) volumetric (-) and (b) skin effect (--) heating of a metal implant with a target temperature of 65°C in 10s. (a,b) Spatial maps of the surface and internal temperature distribution show the faster cool down and lower surface temperatures for skin-effect heating of the implant. Conduction of heat into the implant for skin effect heating accounts for this difference in surface temperature. (c) The temperature profiles on the surface and in tissue reveal a significantly lower temperature achieved in tissue between skin effect and volumetric heating. (d) Radial tissue damage as a function of the time required to reach a target temperature. Faster heating leads to a greater reduction in tissue damage radius for skin effect heating, however, as the heating rate is reduced, the differences become less significant between the two cases.
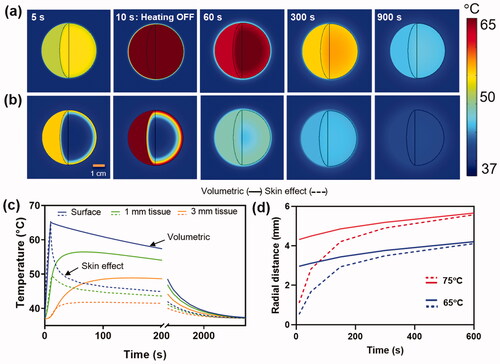
Figure 4. Instantaneous heating of implant: a) The reduction of S. aureus (TIDB1675) biofilm as a function of time for uniform implant heating at 60°C. Superimposed are the times when tissue thermal dose reaches a CEM43 value of 240 min (irreversible damage) at 1, 2 and 3 mm. From the graph it is seen that in order to achieve ∼95% reduction (N = 1.25) of biofilm on the implant surface tissue is irreversibly damaged to a radius of 3mm. b) Similar trends for biofilm reduction as a function of time are shown for a range of implant surface temperature ranging from 60–80°C, along with the times for tissue damage at 1,2 and 3 mm. The image shows that temperatures above 70°C can reduce biofilm (N > 6) in a few seconds while restricting tissue damage to less than a few 1 mm.
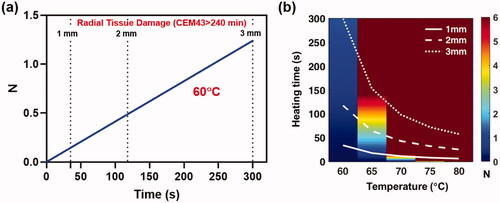
Figure 5. Effect of intermittent heating of implant: Intermittent heating of implant by ramping up to different target temperatures 60–80°C. (a) Intermittent heating and cooling of implant targeting 65°C at 10 s, 35 s and 60 s. (b–g) The number of exposures and thermal damage radii (1,2,3 mm) as a function of the target temperature for fast (10 s), medium (35 s) and slow (60 s) exposure heating times. As the heating time for each exposure is increased, a faster reduction of bacteria is observed, and fewer exposures are required to reach a given surface reduction. However, slower heating is also associated with an increase in the radius of tissue damage for a given number of exposures. The best balance between achieving maximum surface bacteria reduction and minimizing radial tissue damage occurs with the use of higher temperatures, and the fastest possible heating time.
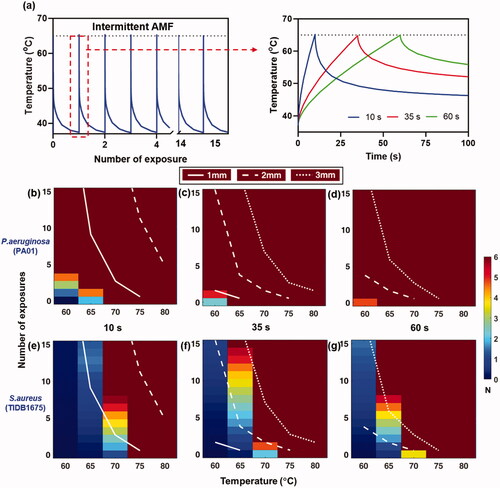
Figure 6. Comparison between fast intermittent exposures (left column) and a single slow exposure (right column) on log10 reduction and tissue damage for a spherical implant. (a,b): Implant surface temperatures for the case where the magnetic field is applied in unidirectionally along the Z axis (left), sequentially along the X, Y, and Z axes (middle), and for uniform heating (right). Temperatures are shown for (a) intermittent (b) slow heating. (c,d): Biofilm reduction of S.aureus (TIDB1675) on the implant surface and a histogram of bacterial reduction (N) for (c)intermittent and (d) slow heating. (e,f): Tissue thermal dose distribution at 3 mm from implant surface and a histogram of thermal dose (CEM43) for (e) intermittent and (f) slow heating.
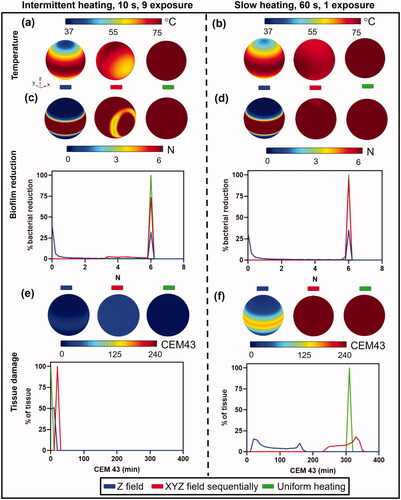
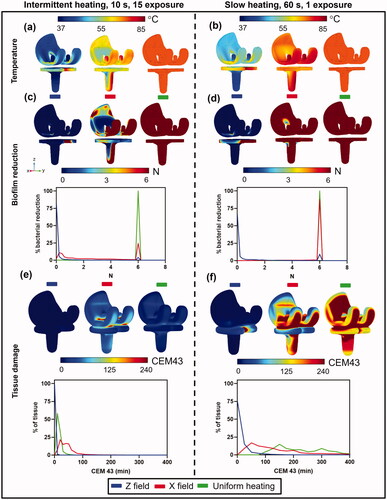
Figure 7. Comparison between fast intermittent exposures (left column) and a single slow exposure (right column) on log10 reduction and tissue damage for a knee implant. (a,b): Implant surface temperatures for the case where the magnetic field is applied in unidirectionally along the Z axis (left), unidirectionally along the X axis (middle), and for uniform heating (right). Temperatures are shown for (a) intermittent (b) slow heating. (c,d): Biofilm reduction of S.aureus (TIDB1675) on the implant surface and a histogram of bacterial reduction (N) for (c) intermittent and (d) slow heating. (e,f): Tissue thermal dose distribution at 3 mm from implant surface and a histogram of thermal dose (CEM43) for (e) intermittent and (f) slow heating.