Figures & data
Figure 1. Spectral absorption coefficient of liquid water as a function of wavelengths within the spectral range of infrared radiation with sub-ranges infrared-A (IR-A), infrared-B (IR-B) and infrared-C (IR-C) [Citation51–53]. Spectral peaks and their extents are caused by basic vibrations of water molecules (v1: symmetric O-H stretching, v2: H-O-H bending, v3: asymmetric O-H stretching, L1: minor libration, L2: major libration) and by their superposition and overtones (IR-A and IR-B), as well as by cluster/collective vibrations due to H-O ··· O stretching/bending (IR-C) [Citation54–57]. Extents of horizontal boxes mark wavelength ranges of respective vibration types (Dashed line supplements data of the spectral absorption coefficient within 0.5 μm and 0.78 μm of the spectral range of visible radiation (VIS) for additional information).
![Figure 1. Spectral absorption coefficient of liquid water as a function of wavelengths within the spectral range of infrared radiation with sub-ranges infrared-A (IR-A), infrared-B (IR-B) and infrared-C (IR-C) [Citation51–53]. Spectral peaks and their extents are caused by basic vibrations of water molecules (v1: symmetric O-H stretching, v2: H-O-H bending, v3: asymmetric O-H stretching, L1: minor libration, L2: major libration) and by their superposition and overtones (IR-A and IR-B), as well as by cluster/collective vibrations due to H-O ··· O stretching/bending (IR-C) [Citation54–57]. Extents of horizontal boxes mark wavelength ranges of respective vibration types (Dashed line supplements data of the spectral absorption coefficient within 0.5 μm and 0.78 μm of the spectral range of visible radiation (VIS) for additional information).](/cms/asset/e41637b9-9572-4498-81ae-d3de5deffbe8/ihyt_a_2067596_f0001_c.jpg)
Figure 2. Dielectric loss ε" of pure liquid water at temperatures of 2 °C (curve 1), 37 °C (curve 2) and 47 °C (curve 3), and of intracellular water at 1 °C (curve 4, open circles) as a function of frequency between 300 MHz and 20 THz [Citation59,Citation63]. Relaxation times decreased in pure water from τ ≈ 18 ps at 2 °C to τ ≈ 6 ps at 37 °C, and to τ ≈ 5.3 ps at T = 47 °C [Citation59]. Debye Peak frequencies at νp ≈ 9 GHz (2 °C), at νp ≈ 26 GHz (37 °C) and at νp ≈ 30 GHz (47 °C), and extents of peak maxima of dielectric loss at ε'' ≈ 40% (2 °C), at ε'' ≈ 36% (37 °C) and at ε'' ≈ 34 (47 °C) [Citation59]. Respective data for intracellular water at 1 °C: τ ≈ 20 ps, νp ≈ 8 GHz, and ε'' ≈ 27 (at maximum) [Citation63].
![Figure 2. Dielectric loss ε" of pure liquid water at temperatures of 2 °C (curve 1), 37 °C (curve 2) and 47 °C (curve 3), and of intracellular water at 1 °C (curve 4, open circles) as a function of frequency between 300 MHz and 20 THz [Citation59,Citation63]. Relaxation times decreased in pure water from τ ≈ 18 ps at 2 °C to τ ≈ 6 ps at 37 °C, and to τ ≈ 5.3 ps at T = 47 °C [Citation59]. Debye Peak frequencies at νp ≈ 9 GHz (2 °C), at νp ≈ 26 GHz (37 °C) and at νp ≈ 30 GHz (47 °C), and extents of peak maxima of dielectric loss at ε'' ≈ 40% (2 °C), at ε'' ≈ 36% (37 °C) and at ε'' ≈ 34 (47 °C) [Citation59]. Respective data for intracellular water at 1 °C: τ ≈ 20 ps, νp ≈ 8 GHz, and ε'' ≈ 27 (at maximum) [Citation63].](/cms/asset/823fe841-0a14-4c71-80ce-43dc9928d072/ihyt_a_2067596_f0002_c.jpg)
Figure 3. Dielectric loss ε" in splenic hematoma (curve 1, squares), intestinal leiomyosarcoma (curve 2, dots), hemangiopericytoma (curve 3, stars)) and in NaCl solution of different salinity: 0.9% w/v (curve 4, open triangles), 0.5% w/v (curve 5, solid triangles) as a function of frequency between 10 MHz and 20 GHz. Data for NaCl solutions were measured by Gadani DH et al. [Citation60]. Data for splenic hematoma and for both tumor tissues were calculated using data of conductivity measurements performed by Schepps and Foster [Citation64] according to EquationEquation (3)(3)
(3) .
![Figure 3. Dielectric loss ε" in splenic hematoma (curve 1, squares), intestinal leiomyosarcoma (curve 2, dots), hemangiopericytoma (curve 3, stars)) and in NaCl solution of different salinity: 0.9% w/v (curve 4, open triangles), 0.5% w/v (curve 5, solid triangles) as a function of frequency between 10 MHz and 20 GHz. Data for NaCl solutions were measured by Gadani DH et al. [Citation60]. Data for splenic hematoma and for both tumor tissues were calculated using data of conductivity measurements performed by Schepps and Foster [Citation64] according to EquationEquation (3)(3) σ(ω)=ωε0εr″(ω),(3) .](/cms/asset/b3c2cf98-03c1-4068-a9fe-18b505ed9f03/ihyt_a_2067596_f0003_c.jpg)
Figure 4. Dielectric loss ε" in normal tissues (blue symbols: fat (triangles, upward), bone (triangles (downward), lung (dots), muscle (stars)) and in NaCl solution (salinity = 0.4% w/v, black hexagon) at frequencies of 13.56 MHz (curve 1, solid symbols) and of 434 MHz (curve 2, open symbols) as a function of water content of tissues. Data for dielectric loss were calculated using data of conductivity measurements by Kok and Crezee [Citation65] according to EquationEq. 3(3)
(3) . Data for water content according to Pethig and Kell [Citation61].
![Figure 4. Dielectric loss ε" in normal tissues (blue symbols: fat (triangles, upward), bone (triangles (downward), lung (dots), muscle (stars)) and in NaCl solution (salinity = 0.4% w/v, black hexagon) at frequencies of 13.56 MHz (curve 1, solid symbols) and of 434 MHz (curve 2, open symbols) as a function of water content of tissues. Data for dielectric loss were calculated using data of conductivity measurements by Kok and Crezee [Citation65] according to EquationEq. 3(3) σ(ω)=ωε0εr″(ω),(3) . Data for water content according to Pethig and Kell [Citation61].](/cms/asset/8c28501b-34b4-4f4e-8efc-2fc0c0624109/ihyt_a_2067596_f0004_c.jpg)
Table 1. Mean water content (Cw) and specific heat capacity (cp) of liquid water, body fluids, normal human tissues (selection) and biological media*.
Table 2. Mean water content (Cw) and specific heat capacity (cp) of normal human tissues vs. corresponding tumor tissues (selection).
Table 3. Water contents (Cw) and specific heat capacities (cp) of the multilayer tissue structures exposed in hyperthermia treatment of breast cancers.
Figure 5. Specific heat capacity cp of liquid pure water, body fluids, normal human tissues (selection), and biological media as a function of mean water content within the ranges Cw = 10–100 wt.% (5A), Cw = 70–100 wt.% (5 B), and Cw < 70 wt.% (5C) according to data listed in .
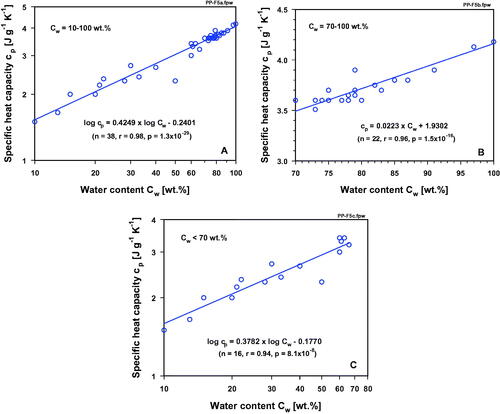
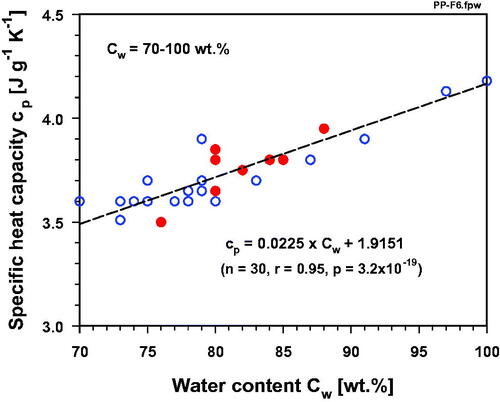
Figure 6. Specific heat capacity cp of liquid pure water, body fluids, normal human tissues (selection), biological media (blue circles), and of tumor tissues (selection, red dots) as a function of mean water content within the range Cw = 70–100 wt.% according to data listed in and .