Figures & data
Figure 1. The geometric model of RFA for a liver tumor abutting a vascular structure: (a) a 3 D view and (b) X-Z cross-sectional view (with the variables () of electrode placement; dimension in mm and out of scale).
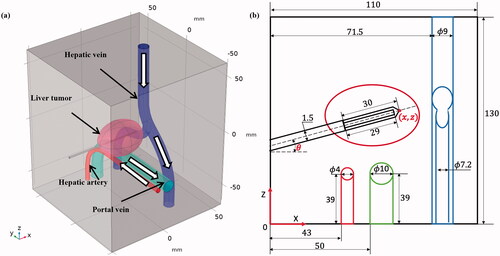
Table 1. The velocity and diameter of three vessels in the hepatic vascular system [Citation27].
Table 2. Characteristics of the materials used in the theoretical model [Citation32–34].
Figure 2. The demonstration of impedance changes along with the energy supply under the impedance-controlled ablation protocol.
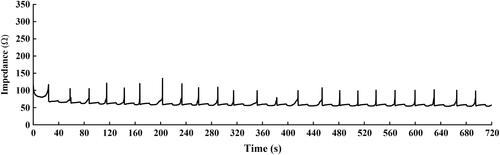
Figure 3. The quantification method of vessel thermal damage.
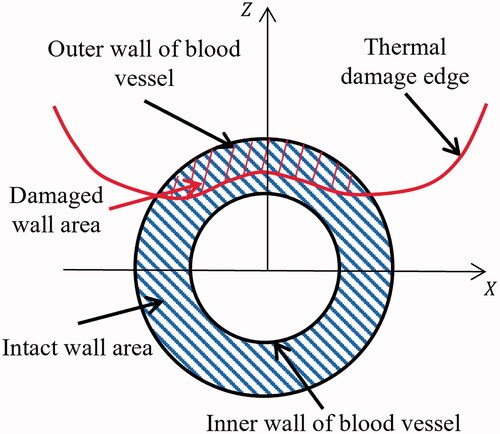
Figure 4. (a) the temperature change at 5, 10, 15, and 20 mm from the center of RF electrode, and (b) the temperature distribution at the ending of RFA treatment.
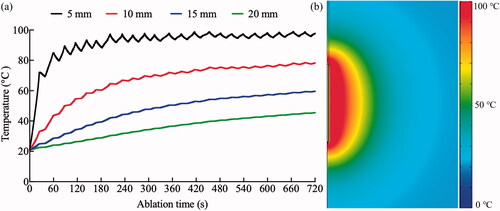
Table 3. Comparison of the temperature between the proposed RFA computer model and the ex vivo experiments.
Table 4. Results of ablation and thermal damage for each designed simulation.
Table 5. The value of coefficient in RSM regression model.
Figure 5. The multi-objective optimization results of RSM (the red solid line and blue dashed line represent the optimal solutions and predictive results of the regression models, respectively).
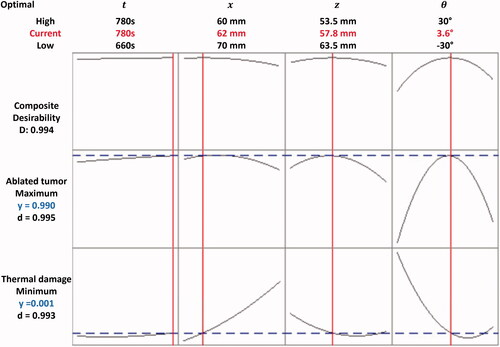
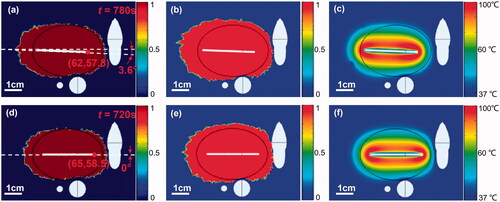
Figure 6. The RFA treatment results in X-Z cross-sectional view: (a–c) ablation, thermal damage, and temperature distribution, respectively for the optimized protocol; (d–f) ablation, thermal damage, and temperature distribution, respectively for the reference protocol. (The black line is the contour line of tumor).