Figures & data
Figure 1. Experimental treatment set-up for analyses of cell death forms and immune checkpoint molecule expression and the release of the danger signal HSP70 of glioblastoma cells following RT and/or HT treatments. The glioblastoma cells were seeded one day prior to the treatment (d-1d). The experiment consists of a HT arm, a RT arm and a combination arm of HT and RT (RHT). For effective heating, the 75 cm2 t-flasks were placed in the heat chamber for 60 min. Irradiation was performed over 5 days with 2 Gy each and took place in the RHT arm 60 min after hyperthermia. Both RT and RHT samples were always irradiated at the same time. Standard sampling was performed in all arms on day 0 (d0), d3 (72 h) and d5 (120 h).
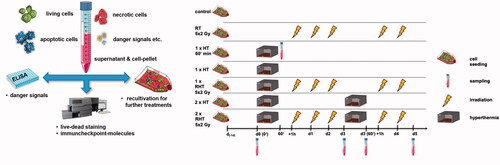
Figure 2. Development of a heating chamber with accurate temperature control. By combining experimental measurements and simulation, a very accurate basis of heat application in the preclinical in vitro hyperthermia setting is assured: Design drawing of the heating chamber (a), simulation model within COMSOL® Multiphysics (b) and simulated temperature profile to achieve Ttarget of 39 °C (blue line), 41 °C (green line) and 44 °C (red line) starting from Tbase of 37 °C (c). The average temperature may deviate from the set temperature by a maximum of ± 0.1 °C and the heating power is regulated by a control unit itself which is connected to a thermocouple on the heating plate.
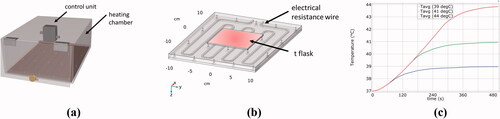
Table 1. Antibodies used for the analyses of the surface expression of immune checkpoint molecules and of EGFR by multicolor flow cytometry [Citation27].
Figure 3. Glioblastoma cells are rather radioresistant, but combination with hyperthermia increases particularly apoptosis and at 44 °C also necrosis in U251 cells. Percentages of apoptotic and necrotic of U87 and U251 glioblastoma cells after normofractionated radiotherapy and hyperthermia treatment at different temperatures and after single (1x) and double (2x) application is displayed. Apoptosis of U87 (a), apoptosis of U251 (b), necrosis of U87 (c) and necrosis of U251 (d) were analyzed by AxV/PI-staining and multicolor flow cytometry measurement 60 min after treatment (d = 0) and at day 5. Standard deviation is derived from at least four independent experiments, each measured in duplicates. Statistics: Kruskal-Wallis test with uncorrected Dunn’s multiple comparison comparing the treatment-related total percentages of apoptotic and necrotic cells to the corresponding controls of untreated cells at the indicated time points (d0, d5); *(p < 0.05), **(p < 0.01), ***(p < 0.001), ****(p < 0.0001).
Figure 4. U251 cells that show necrosis induction after combined treatment with RHT and HT with 44 °C also release increased amounts of HSP70 under these conditions. Heatmaps of HSP 70 protein content (ng/106 cells) in supernatant of U87 and U251 tumor cells are shown. After the treatments with hyperthermia (HT), radiotherapy (RT) or combination (RHT), the danger signal HSP 70 was detected in the supernatant of U87 (a) and U251 (b) cells at the indicated time points (day 3 and 5). Additionally, HSP70 was analyzed 60 min after HT on day 0. Note the difference in scaling between the two cell lines: The maximum of total protein content is higher in U251 cells. Standard deviation is derived from at least four independent experiments, each measured in duplicates. Statistics: Kruskal-Wallis test with uncorrected Dunn’s multiple comparison comparing the protein content of the respective treated cells to the corresponding controls of untreated cells at the indicated time points (d0, d5); * (p < 0.05), **(p < 0.01), ***(p < 0.001), ****(p < 0.0001).
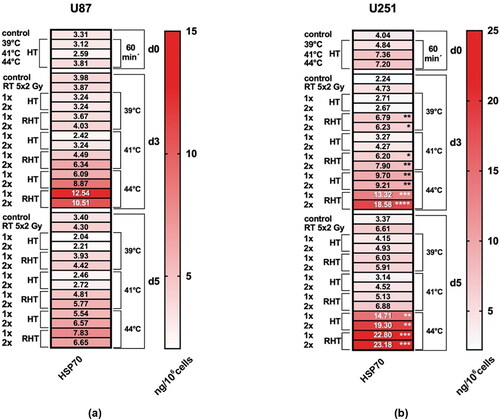
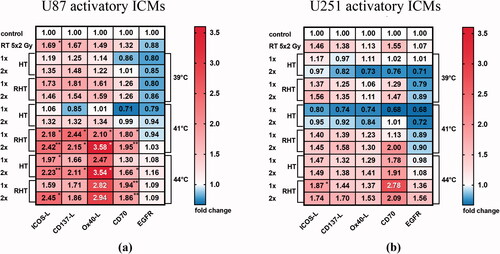
Figure 5. Immune suppressive checkpoint molecules were significantly increased mostly on U87 cells, and particularly after RHT with 41 °C and 44 °C. Heatmaps of normalized expression (change in mean fluorescence intensity compared to untreated cells) of immunosuppressive checkpoint molecules (ICMs) on day 5 on the cell surface of U87 (a) and U251 (b) human glioblastoma cells after normofractionated radiotherapy and hyperthermia are shown. Standard deviation is derived from five independent experiments, each measured in duplicates. Statistics: Kruskal-Wallis test with uncorrected Dunn’s multiple comparison; *(p < 0.05), ** (p < 0.01), ***(p < 0.001).
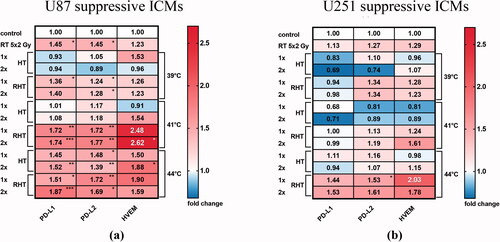
Figure 6. Immune stimulatory checkpoint molecules were significantly increased mostly on U87 cells, and particularly after RHT with 41 °C. Heatmaps of normalized expression (change in mean fluorescence intensity compared to untreated cells) of immune activating checkpoint molecules (ICMs) and of EGFR on day 5 on the cell surface of U87 (a) and U251 (b) human glioblastoma cells after normofractionated radiotherapy and hyperthermia are shown. Standard deviation is derived from five independent experiments, each measured in duplicates. Statistics: Kruskal-Wallis test with uncorrected Dunn’s multiple comparison; *(p < 0.05), ** (p < 0.01), ***(p < 0.001).