Figures & data
Table 1. MRI scan parameters.
Figure 1. MicroSea 3D Image Processing Software was used to sketch the non-perfused volume layer by layer on contrast-enhanced magnetic resonance imaging.
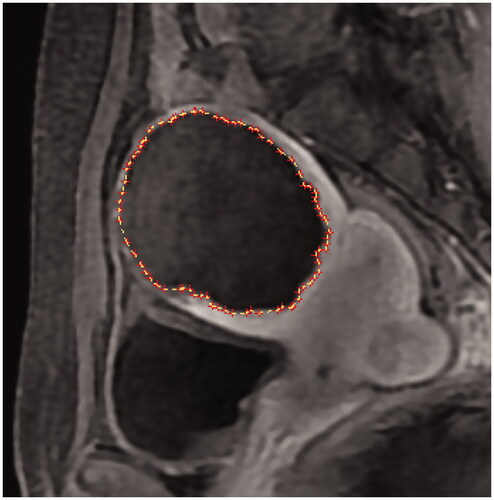
Figure 2. (A–E) Method for measuring the maximum thickness of residual fibroids. (F–J) Method for counting the basal distribution of residual fibroids. (F) No residual fibroid, 0; (G) limited distribution, 1 quadrant; (H) small distribution, 2 quadrants; (I) obvious distribution, 3 quadrants; (J) extensive distribution, 4 quadrants.
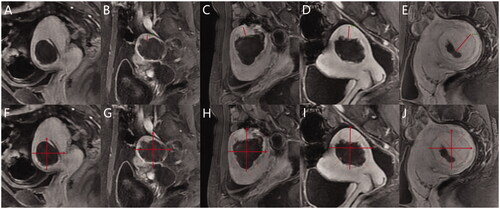
Table 2. Baseline characteristics of all uterine fibroids.
Figure 3. The Boruta algorithm was used for feature screening and ranking. (A), (C) Box plots of all features attribute plus minimum, average, and maximum shadow scores; green variables were of predictive importance, yellow variables were tentative and red variables were eliminated. (B), (D) The decision process of the Boruta algorithm to accept and reject features. FIGO: International Federation of Gynecology and Obstetrics; T2WI: T2-weighted imaging; NPV: non-perfused volume; RFV: residual fibroid volume.
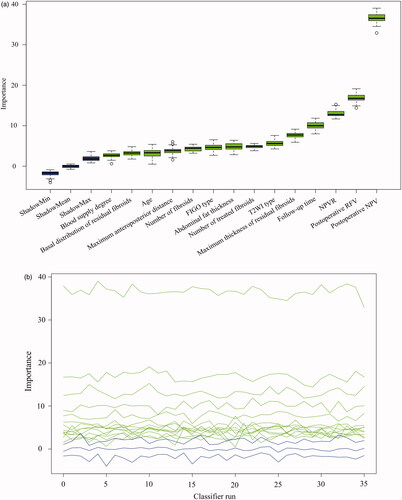
Figure 3. Continued
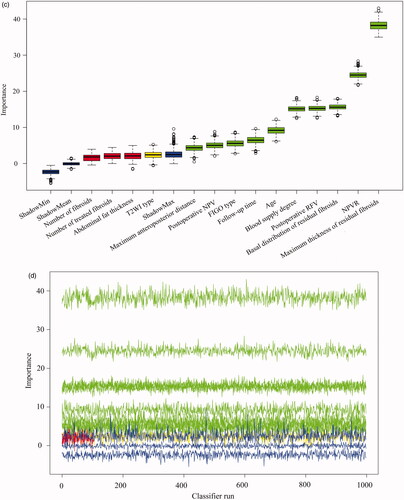
Figure 4. Comparison of the real and predicted values of NPV reduction in the testing set. (A) LiR. (B) RF. (C) MLP. LiR: linear regression; RF: random forest; MLP: multilayer perceptron; NPV: non-perfused volume.
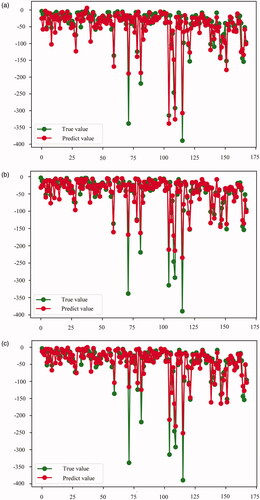
Table 3. Performance of the three machine learning models for predicting NPV reduction.
Figure 5. Area under the receiver operating characteristic curves of LoR, RF, and MLP to predict residual fibroid regrowth. (A) Training set results. (B) Testing set results. LoR: logistic regression; RF: random forest; MLP: multilayer perceptron.
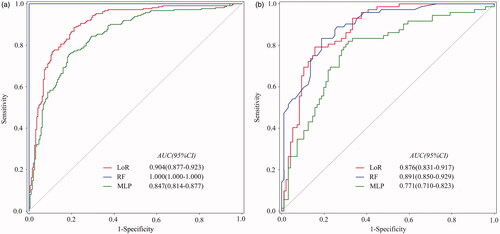
Table 4. Performance of three machine learning models for predicting residual fibroid regrowth.
Figure 6. (A–D) A 29-year-old woman with a single uterine fibroid in the testing set. T2WI type: IV; FIGO type: 3; CE-MRI showed rich blood supply. The patient returned for MRI review 100 days after postoperative MRI evaluation. Maximum thickness of residual fibroids: 0.85 cm. Basal distribution of residual fibroids: two quadrants. Postoperative NPV: 37.3 cm3; postoperative RFV: 27.0 cm3; NPVR: 58.01%. NPV reduction value: 26.7 cm3. RFV increased by 19.63%. Predictive result of the NPV reduction value: 25.7 cm3; predictive result of residual fibroids: regrowth. (E–H) A 32-year-old woman with a single uterine fibroid in the testing set. T2WI type: III; FIGO type: 4; CE-MRI showed a lack of blood supply. The patient returned for MRI review 105 days after postoperative MRI evaluation. Maximum thickness of residual fibroids: 0.65 cm. The basal distribution of residual fibroids: two quadrants. Postoperative NPV: 332.7 cm3; postoperative RFV: 26.1 cm3; NPVR: 92.73%. NPV reduction value: 135.9 cm3. RFV decreased by 18.77%. Predictive result of NPV reduction was 103.8 cm3; predictive result of residual fibroid: non-regrowth. CE-MRI: contrast-enhanced magnetic resonance imaging; FIGO: International Federation of Gynecology and Obstetrics; T2WI: T2-weighted imaging; NPV: non-perfused volume; RFV: residual fibroid volume.
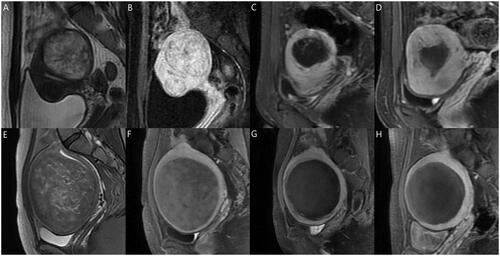
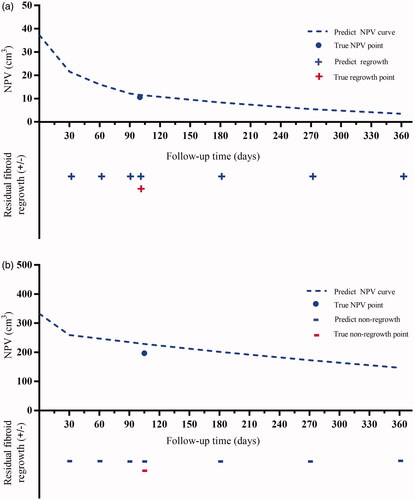
Figure 7. Prognostic prediction curves of the two cases in . The dotted lines predict NPV values over time. The ‘•’ shows the true NPV values. The ‘+’ and ‘-’ mean regrowth and non-regrowth, respectively. (A) Residual fibroid regrowth was observed at 30, 60, 90,100, 180, 270, and 360 days after treatment, indicating continuous growth of residual fibroids; (B) The residual fibroids remained non-regrowth at 30, 60, 90, 105, 180, 270, and 360 days after treatment, showing no trend for fibroid recurrence; therefore, frequent MRI examination and excessive worry are unnecessary. NPV: nonperfused volume; MRI: magnetic resonance imaging.