
Figures & data
Figure 1. Enhanced MR images of uterine fibroids with different ablation rates (NPVR) after HIFU treatment (a) For anterior uterine fibroids, no perfusion volume (NPV) was 48.1 cm3, and NPVR was 62.3%. (b) Anterior uterine fibroids, with NPV of 69.1 cm3 and NPVR of 72.0%; (c) Anterior uterine fibroids, with NPV of 90.2 cm3 and NPVR of 88.9%; (d) Anterior uterine fibroids, NPV 69.2 cm3, NPVR 99.6%.
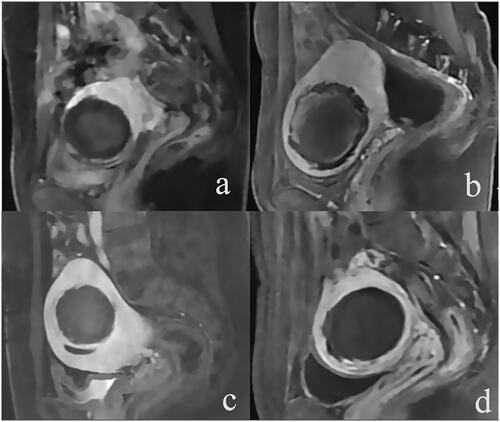
Table 1. Comparison of SIR-B lower abdominal pain in patients with different NPVR groups.
Table 2. Logistics regression analysis of NPVR and SIR-B lower abdominal pain.
Table 3. UFS-QoL comparison of patients in different NPVR groups.
Table 4. Correlation analysis of 12 – month UFS improvement and NPVR.