Figures & data
Table 1. Values of the dielectric properties at 13.56 MHz (unless otherwise specified) and the densities and thermal properties used in the simulations [Citation21,Citation22]; conductivity (σ [S m−1] and relative permittivity (εr [-]), density (ρ [kg m−3]), specific heat capacity (c [J kg−1°C−1]), thermal conductivity (k [W m−1°C−1]) and perfusion (Wb [kg m−3 s−1]).
Figure 1. A bony sphere (diameter 5 cm) is placed inside a homogeneous muscle cylinder (diameter 30 cm and height 20 cm). A constant electric field oriented in the z-direction is applied.
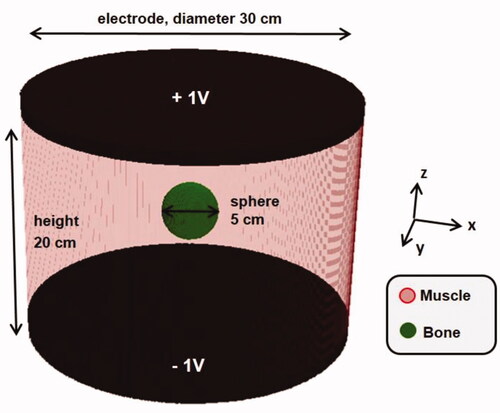
Figure 2. Different phantom set-ups evaluated for the Thermotron RF8 capacitive hyperthermia device. Measurements for these set-ups have been reported by Song et al. [Citation24], which were used here to validate treatment planning predictions by Plan2Heat.
![Figure 2. Different phantom set-ups evaluated for the Thermotron RF8 capacitive hyperthermia device. Measurements for these set-ups have been reported by Song et al. [Citation24], which were used here to validate treatment planning predictions by Plan2Heat.](/cms/asset/33e62576-bbc2-4fcb-8139-47e5c60f2731/ihyt_a_2093996_f0002_c.jpg)
Figure 3. Different phantom set-ups evaluated for the Celsius TCS capacitive hyperthermia device. Measurements for these set-ups have been reported by Beck et al. [Citation25], which were used here to validate treatment planning predictions by Plan2Heat.
![Figure 3. Different phantom set-ups evaluated for the Celsius TCS capacitive hyperthermia device. Measurements for these set-ups have been reported by Beck et al. [Citation25], which were used here to validate treatment planning predictions by Plan2Heat.](/cms/asset/44035fb8-fbee-481b-96cb-487d2e5280f3/ihyt_a_2093996_f0003_c.jpg)
Figure 4. Different electrode combinations and treatment positioning (prone or supine) evaluated for an anal carcinoma patient to determine the most favorable treatment set-up.
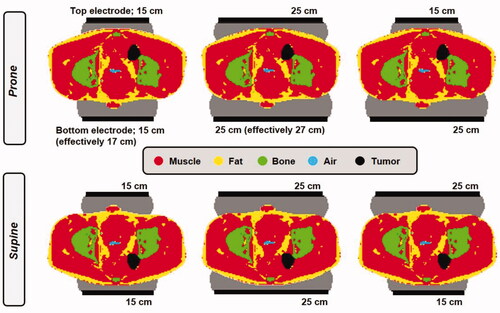
Figure 5. Analytical solution for a spherical object (bone) placed inside a homogeneous electric field, as illustrated in , together with numerical solutions for this problem achieved with the quasi-static solver of Plan2Heat. Profiles of the power density (PD) along the x-direction (A), and z-direction (B) are shown. The simulation resolution was 5, 2.5 and 1 mm.
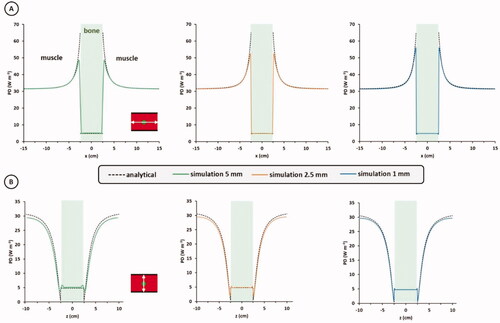
Figure 6. Simulated normalized SAR distributions (left), and measured and simulated profiles (right) for the Thermotron RF8 system using two equally sized electrodes of either 25 cm or 10 cm diameter on a cylindrical phantom (). Measurements were taken from Song et al. [Citation24].
![Figure 6. Simulated normalized SAR distributions (left), and measured and simulated profiles (right) for the Thermotron RF8 system using two equally sized electrodes of either 25 cm or 10 cm diameter on a cylindrical phantom (Figure 2). Measurements were taken from Song et al. [Citation24].](/cms/asset/6e88f376-7b15-42a0-99d6-ce06fb0408ea/ihyt_a_2093996_f0006_c.jpg)
Figure 7. Simulated normalized SAR distributions (left), and measured and simulated profiles (right) for the Thermotron RF8 system using two electrodes with different diameters on a cylindrical phantom (). Measurements were taken from Song et al. [Citation24].
![Figure 7. Simulated normalized SAR distributions (left), and measured and simulated profiles (right) for the Thermotron RF8 system using two electrodes with different diameters on a cylindrical phantom (Figure 2). Measurements were taken from Song et al. [Citation24].](/cms/asset/9011dd52-b98d-4b58-b48c-2ed7518f36db/ihyt_a_2093996_f0007_c.jpg)
Figure 8. Simulated normalized SAR distribution and measured and simulated profiles for the Celsius TCS system using two 15 cm diameter electrodes on a rectangular homogeneous 2/3 muscle phantom (). Measurements were taken from Beck et al. [Citation25].
![Figure 8. Simulated normalized SAR distribution and measured and simulated profiles for the Celsius TCS system using two 15 cm diameter electrodes on a rectangular homogeneous 2/3 muscle phantom (Figure 3). Measurements were taken from Beck et al. [Citation25].](/cms/asset/36c80ede-cbc8-4c68-8784-6e5cd2866878/ihyt_a_2093996_f0008_c.jpg)
Figure 9. Simulated normalized SAR distribution and measured and simulated profiles for the Celsius TCS system using a top and bottom electrode with a diameter of 25 cm and 15 cm, respectively on a rectangular homogeneous 2/3 muscle phantom (). Measurements were taken from Beck et al. [Citation25].
![Figure 9. Simulated normalized SAR distribution and measured and simulated profiles for the Celsius TCS system using a top and bottom electrode with a diameter of 25 cm and 15 cm, respectively on a rectangular homogeneous 2/3 muscle phantom (Figure 3). Measurements were taken from Beck et al. [Citation25].](/cms/asset/80a93d2f-039a-4f3d-82d1-45f395c02e94/ihyt_a_2093996_f0009_c.jpg)
Figure 10. Simulated normalized SAR distribution and measured and simulated profiles for the Celsius TCS system using a top and bottom electrode with a diameter of 15 cm and 15 cm, respectively on a rectangular fat-muscle phantom (). Measurements were taken from Beck et al. [Citation25].
![Figure 10. Simulated normalized SAR distribution and measured and simulated profiles for the Celsius TCS system using a top and bottom electrode with a diameter of 15 cm and 15 cm, respectively on a rectangular fat-muscle phantom (Figure 3). Measurements were taken from Beck et al. [Citation25].](/cms/asset/d021984a-32e6-4fcd-943c-e8bf93b0b35c/ihyt_a_2093996_f0010_c.jpg)
Figure 11. Simulated normalized SAR distribution and measured and simulated profiles for the Celsius TCS system using a top and bottom electrode with a diameter of 15 cm and 15 cm, respectively on a rectangular 2/3 muscle phantom with a cylindrical bone structure inside (). Measurements were taken from Beck et al. [Citation25].
![Figure 11. Simulated normalized SAR distribution and measured and simulated profiles for the Celsius TCS system using a top and bottom electrode with a diameter of 15 cm and 15 cm, respectively on a rectangular 2/3 muscle phantom with a cylindrical bone structure inside (Figure 3). Measurements were taken from Beck et al. [Citation25].](/cms/asset/1109fde0-8d0f-4584-b825-0242a68810c4/ihyt_a_2093996_f0011_c.jpg)
Table 2. Predicted SAR values and HTQ for different electrode combinations and treatment positioning (prone or supine) when heating an anal cancer patient with the Celsius TCS device.
Figure 12. Simulated indexed temperatures T90, T50 and T10 for different electrode combinations and treatment positioning (prone or supine). Water bolus temperatures reflecting the clinically relevant range were used (10 °C or 18 °C) and power was scaled such that the maximum normal tissue temperature did not exceed 45 °C for all situations.
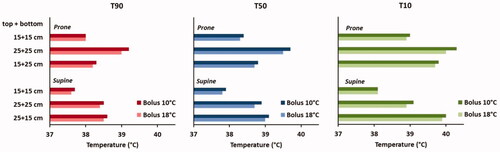
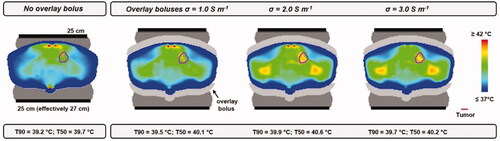
Figure 13. Simulated 1 cc SAR distribution and corresponding temperature distribution for the optimal treatment set-up: the patient in prone position and two 25 cm diameter electrodes. The water bolus temperature was 10 °C and total power was scaled such that the maximum predicted normal tissue temperature did not exceed 45 °C.
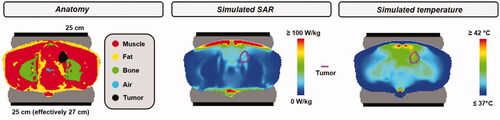
Figure 14. Simulated temperature distributions when applying 10 °C overlay boluses at various salinities, compared with the default situation without overlay boluses. The optimal treatment set-up for this patient was considered, i.e., prone position and two 25 cm diameter electrodes. Total power was scaled such that the maximum predicted normal tissue temperature did not exceed 45 °C.