
Figures & data
Table 1. Inclusion/exclusion criteria.
Table 2. Patient characteristics of dogs enrolled in the study.
Table 3. Thermal Injuries (Burn scores) induced by HIFU at day of tumor surgical resection (day 4–6 post HIFU), adapted by Wohlsein et al.
Figure 1. HIFU treatment of a dog diagnosed with 2 masses located on the proximal left leg, infiltrating the triceps muscle. Both masses were diagnosed as low grade liposarcoma. (A) Treatment setup. The dog is under inhalational general anesthesia in combination with local block of his left brachial nerve. The VTU is positioned over the targeted tumor, and the treatment is monitored in real time via ultrasonography. (B) Gross image of the resected tumors. The yellow star indicates the treated tumor, characterized by diffuse hemorrhage and tan color, and the red star indicates the untreated tumor, lacking hemorrhage and pale white color. (C) The tumor treatment site (yellow circle) 4 days post HIFU treatment with no visible evidence of heat damage. (D) Microscopy image of the treated tumor stained with standard H&E, demonstrating coagulative necrosis and haemorrhage.
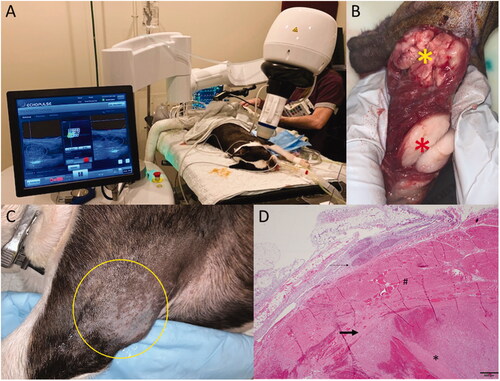
Figure 2. Thermal injury to the skin, 4–6 days post HIFU treatment. The haircoat over the tumor site was removed immediately before the treatment. (A) No evidence of thermal injury. (B) Second degree burn. (C) Third degree burn. (D) Fourth degree burn.
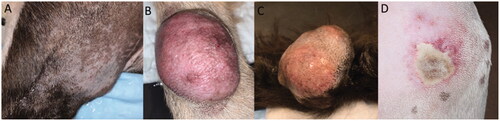
Figure 3. Gross images of 3 different representative treated tumor samples. Grossly, treatment areas were generally characterized by discrete foci of hemorrhage and tissue softening as seen in images (A and B). In some samples, treatment areas were less discrete and characterized by pallor with a rim of hemorrhage as seen in image (C).
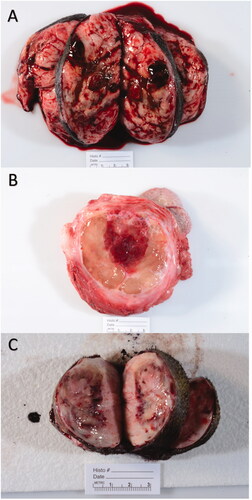
Figure 4. Select representative histopathology of patient tumors. This Figure illustrates the treated tumor at low magnification (top row), and high magnification (middle row) of four selected patients with soft tissue sarcomas that were treated with HIFU. Though treatment areas were somewhat variable, the most consistent finding is a relatively discrete focus of tumor necrosis (arrows) with hemorrhage at low magnification. In some patients (Patient B), hemorrhage and individualization of tumor cells were the most prominent feature. At higher magnification (middle row), necrotic cells exhibit coagulative necrosis characterized by individualization of cells, angular cell borders, increased ‘pinkness’ of the cytoplasm (hypereosinophilia), and dark nuclei or decrease in nuclear visibility. The bottom row illustrates what intact tumor cells look like for that patient in untreated areas of the tumor. Images taken at 2x (top row) or 40x (middle and bottom rows), H&E.
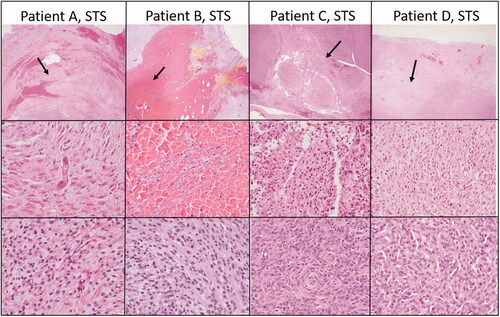
Figure 5. Representative immunohistochemistry images from patients treated in our HIFU study. The top row illustrates CD3 immunohistochemistry for dogs diagnosed with soft tissue sarcomas that were treated with HIFU while the bottom row illustrates IBA-1 immunohistochemistry for the same patients. Positive cells are stained red. CD3+ cells are present throughout the untreated tumor cells as well as at the interface and within the treated section. There is not a definitive or consistence difference in the number of CD3+ cells at the treatment interface. IBA1+ cells, however, consistently were high in numbers at the treatment interface though were also present within untreated and treated tumor as well. Treated tumor is marked with a yellow star. Images taken at 20x, DAB counterstain.
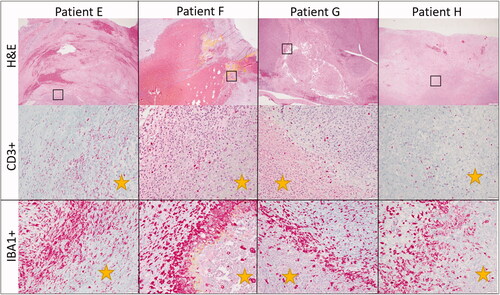
Figure 6. Kaplan-Meier survival estimate for dogs in the study treated with HIFU and tumor was resected (N = 15). The median overall survival time for the study population was not reached.
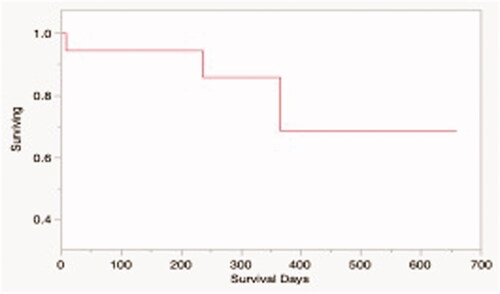
Table 4. Genes with statistically significant expression changes post HIFU, in the Soft Tissue Sarcoma group.
Data availability statement
Data were generated at the Virginia-Maryland College of Veterinary Medicine and are available from the corresponding author JC on request.