
Figures & data
Figure 1. Distribution of relapse events according to site of relapse (local, regional or distant).
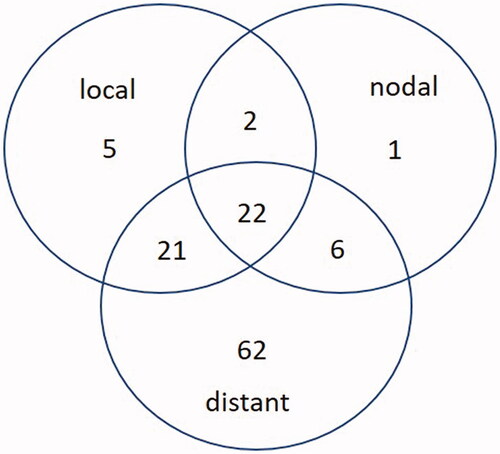
Table 1. Patients, tumor, and treatment characteristics at the time of treatment with RT + HT.
Figure 2. Kaplan–Meier curves for local control (A), overall survival (B), progression-free survival (C) and for local control according to resection status (D), number of HT fractions (E) and combined resection status with applied radiation dose (F).
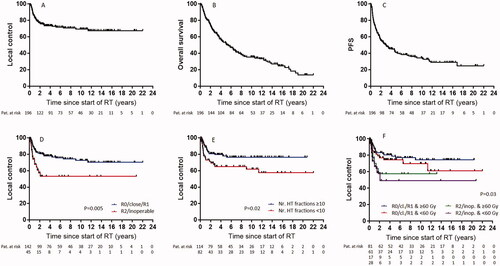
Table 2. Univariate analysis for local control.
Table 3. Multivariate analysis for local control.
Figure 3. Acute (A) and late (B) skin toxicity.

Supplemental material