
Figures & data
Figure 1. Ablation methods for different nodules. (A–C) Nodules that were completely solid or mixed with 90% solid components were directly ablated. The ablation target is the entire nodule. (D–F) For nodules with more than 50% fluid content, the fluid was withdrawn first, followed by saline flushing and ablation. The ablation target is the entire nodule. (G–I) Malignant nodules are ablated directly, and the target for ablation was the entire tumor and the area at least 2 mm from the original tumor margin.
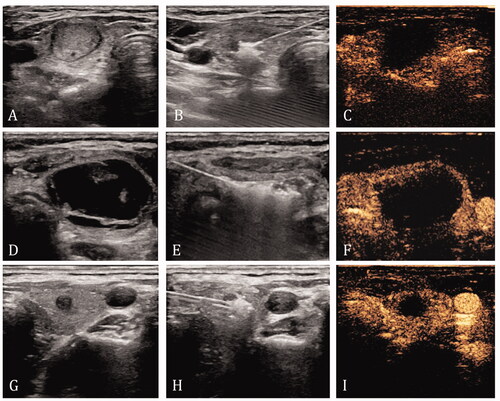
Table 1. Classification and definition of blood pressure levels.
Table 2. Baseline characteristics of patients and nodules undergoing thyroid RFA.
Figure 2. Changes in blood pressure between two groups IV group: intravenous anesthesia group; LA group: local anesthesia group; T0: 30 min before the procedure; T1: 10 min after the procedural beginning; T2: 30 min after the procedure.
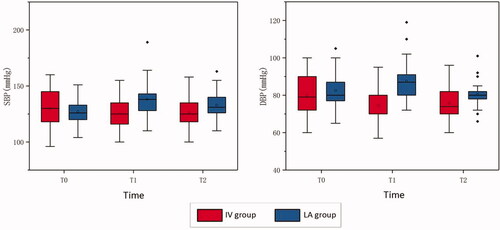
Table 3. Perioperative blood pressure classification of patients in the IV and LA groups.
Table 4. Intra-procedural blood pressure changes in the IV and LA groups.
Table 5. Perioperative pain of patients in the IV and LA groups.
Table 6. Perioperative pain of patients in the IV and LA groups.
Data availability statement
The data supporting the findings of this study are available on request from the corresponding author.